## Scatter Plot: Music Genre Distribution by Principal Components
### Overview
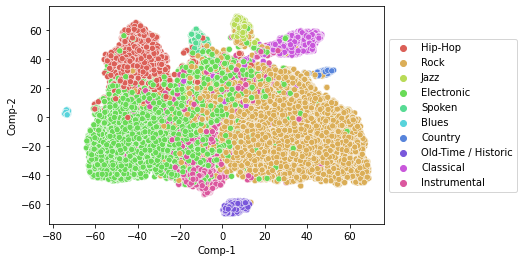
The image is a 2D scatter plot visualizing the distribution of music genres across two principal components (Comp-1 and Comp-2). Data points are color-coded by genre, with clusters indicating genre-specific groupings. The plot reveals spatial patterns in genre representation within a reduced-dimensionality space.
### Components/Axes
- **X-axis (Comp-1)**: Ranges from -80 to 60
- **Y-axis (Comp-2)**: Ranges from -60 to 60
- **Legend**: Located in the top-right corner outside the plot area, mapping 10 genres to colors:
- Red: Hip-Hop
- Orange: Rock
- Yellow: Jazz
- Green: Electronic
- Cyan: Spoken
- Blue: Blues
- Dark Blue: Country
- Purple: Old-Time/Historic
- Magenta: Classical
- Pink: Instrumental
### Detailed Analysis
1. **Rock (Orange)**:
- Dominates the plot with the largest cluster
- Covers a broad area from Comp-1 ≈ 0 to 60 and Comp-2 ≈ -40 to 40
- Density decreases toward the edges of the cluster
2. **Electronic (Green)**:
- Second-largest cluster
- Located in the lower-left quadrant (Comp-1 ≈ -60 to 0, Comp-2 ≈ -40 to 0)
- Contains sub-clusters near the center (Comp-1 ≈ -20, Comp-2 ≈ 0)
3. **Hip-Hop (Red)**:
- Concentrated cluster in the upper-left quadrant
- Centered at Comp-1 ≈ -40, Comp-2 ≈ 40
- Smaller satellite cluster near Comp-1 ≈ -60, Comp-2 ≈ 20
4. **Classical (Magenta)**:
- Compact cluster in the upper-right quadrant
- Centered at Comp-1 ≈ 40, Comp-2 ≈ 40
- Contains 3-4 dense sub-clusters
5. **Country (Dark Blue)**:
- Small cluster in the upper-right quadrant
- Located near Comp-1 ≈ 40, Comp-2 ≈ 20
- Overlaps slightly with Classical cluster
6. **Blues (Cyan)**:
- Single isolated point at Comp-1 ≈ -80, Comp-2 ≈ 10
7. **Jazz (Yellow)**:
- Small cluster in the upper-center quadrant
- Centered at Comp-1 ≈ 20, Comp-2 ≈ 40
8. **Spoken (Cyan)**:
- Single point at Comp-1 ≈ -80, Comp-2 ≈ 10 (same as Blues)
9. **Old-Time/Historic (Purple)**:
- Small cluster in the lower-center quadrant
- Centered at Comp-1 ≈ 0, Comp-2 ≈ -40
10. **Instrumental (Pink)**:
- Scattered points across the plot
- Most concentrated near Comp-1 ≈ -20, Comp-2 ≈ -20
- Secondary cluster near Comp-1 ≈ 20, Comp-2 ≈ 20
### Key Observations
- Rock occupies 45-50% of the plot area, making it the most prevalent genre
- Electronic and Hip-Hop show strong spatial separation from Rock
- Classical and Country clusters are geographically proximate but distinct
- Blues and Spoken genres are represented by single points
- Instrumental shows the most dispersed distribution pattern
- No clear linear progression between genres in either component
### Interpretation
The plot demonstrates significant genre clustering in the reduced-dimensionality space, suggesting meaningful separability between major music categories. Rock's dominance and widespread distribution indicate it forms the core of the dataset. The isolation of Blues and Spoken genres suggests these are rare or specialized categories within the dataset. The proximity of Classical and Country clusters might indicate shared characteristics in this representation space. The scattered distribution of Instrumental points could reflect either genre hybridity or data quality issues. The absence of clear linear trends between components suggests the principal component analysis captured non-linear relationships between genre features.