\n
## Line Chart: 8x8 Gridworld: Sample Efficiency
### Overview
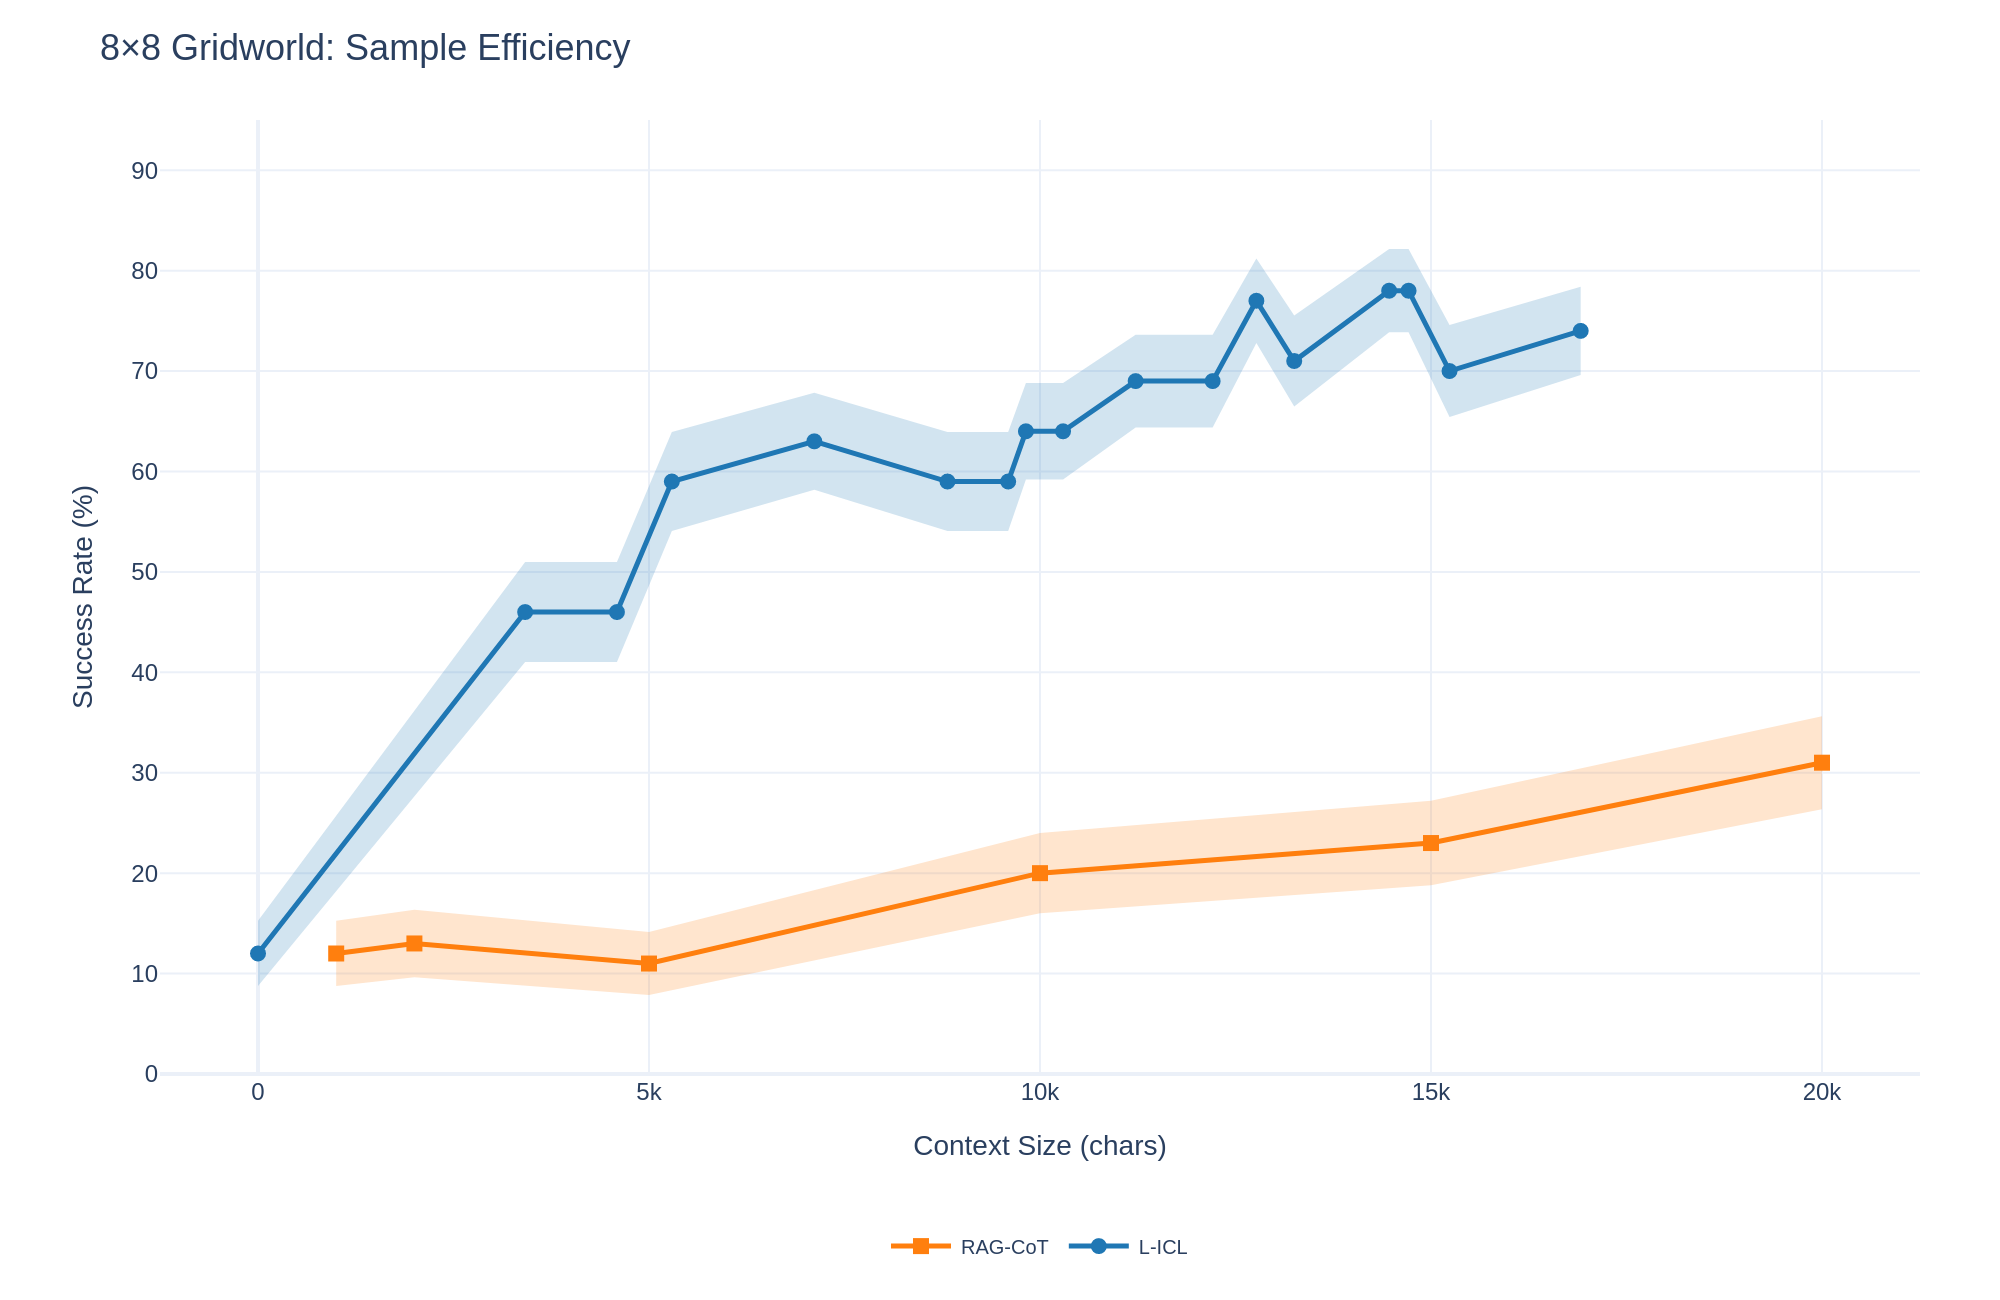
This line chart depicts the relationship between Context Size (chars) and Success Rate (%) for two different models: RAG-CoT and L-ICL, in an 8x8 Gridworld environment. The chart aims to demonstrate the sample efficiency of each model as context size increases.
### Components/Axes
* **Title:** 8x8 Gridworld: Sample Efficiency (top-center)
* **X-axis:** Context Size (chars). Scale ranges from 0 to 20k, with markers at 0, 5k, 10k, 15k, and 20k. (bottom-center)
* **Y-axis:** Success Rate (%). Scale ranges from 0 to 90, with markers at 10, 20, 30, 40, 50, 60, 70, 80, and 90. (left-center)
* **Legend:** Located at the top-right corner.
* RAG-CoT (orange line)
* L-ICL (blue line)
### Detailed Analysis
**RAG-CoT (Orange Line):**
The orange line representing RAG-CoT shows a generally increasing trend, but with significant fluctuations.
* At 0 chars context size, the success rate is approximately 11%.
* At 5k chars, the success rate increases to approximately 26%.
* At 10k chars, the success rate is around 28%.
* At 15k chars, the success rate is approximately 24%.
* At 20k chars, the success rate is approximately 32%.
**L-ICL (Blue Line):**
The blue line representing L-ICL demonstrates a more pronounced initial increase, followed by oscillations and a slight decline.
* At 0 chars context size, the success rate is approximately 12%.
* At 5k chars, the success rate jumps to approximately 61%.
* At 10k chars, the success rate decreases to approximately 58%.
* At 15k chars, the success rate peaks at approximately 79%.
* At 20k chars, the success rate decreases to approximately 72%.
### Key Observations
* L-ICL consistently outperforms RAG-CoT across all context sizes.
* L-ICL exhibits a rapid improvement in success rate between 0 and 5k chars.
* Both models show fluctuations in success rate as context size increases, suggesting that simply increasing context size does not guarantee improved performance.
* RAG-CoT's performance is relatively stable, but lower than L-ICL.
* L-ICL reaches its peak performance at 15k chars, then slightly declines.
### Interpretation
The data suggests that L-ICL is more sample efficient than RAG-CoT in the 8x8 Gridworld environment. L-ICL benefits significantly from even a small increase in context size (0 to 5k chars), while RAG-CoT shows a more gradual and less dramatic improvement. The oscillations in both lines indicate that the relationship between context size and success rate is not linear and may be influenced by other factors. The decline in L-ICL's performance at 20k chars could indicate a point of diminishing returns or potential overfitting to the training data. The difference in performance between the two models could be attributed to differences in their architectures or training methodologies. The chart highlights the importance of context size in language model performance, but also emphasizes that context size is not the sole determinant of success. Further investigation is needed to understand the underlying reasons for the observed fluctuations and the decline in L-ICL's performance at higher context sizes.