## Line Chart: 8×8 Gridworld: Sample Efficiency
### Overview
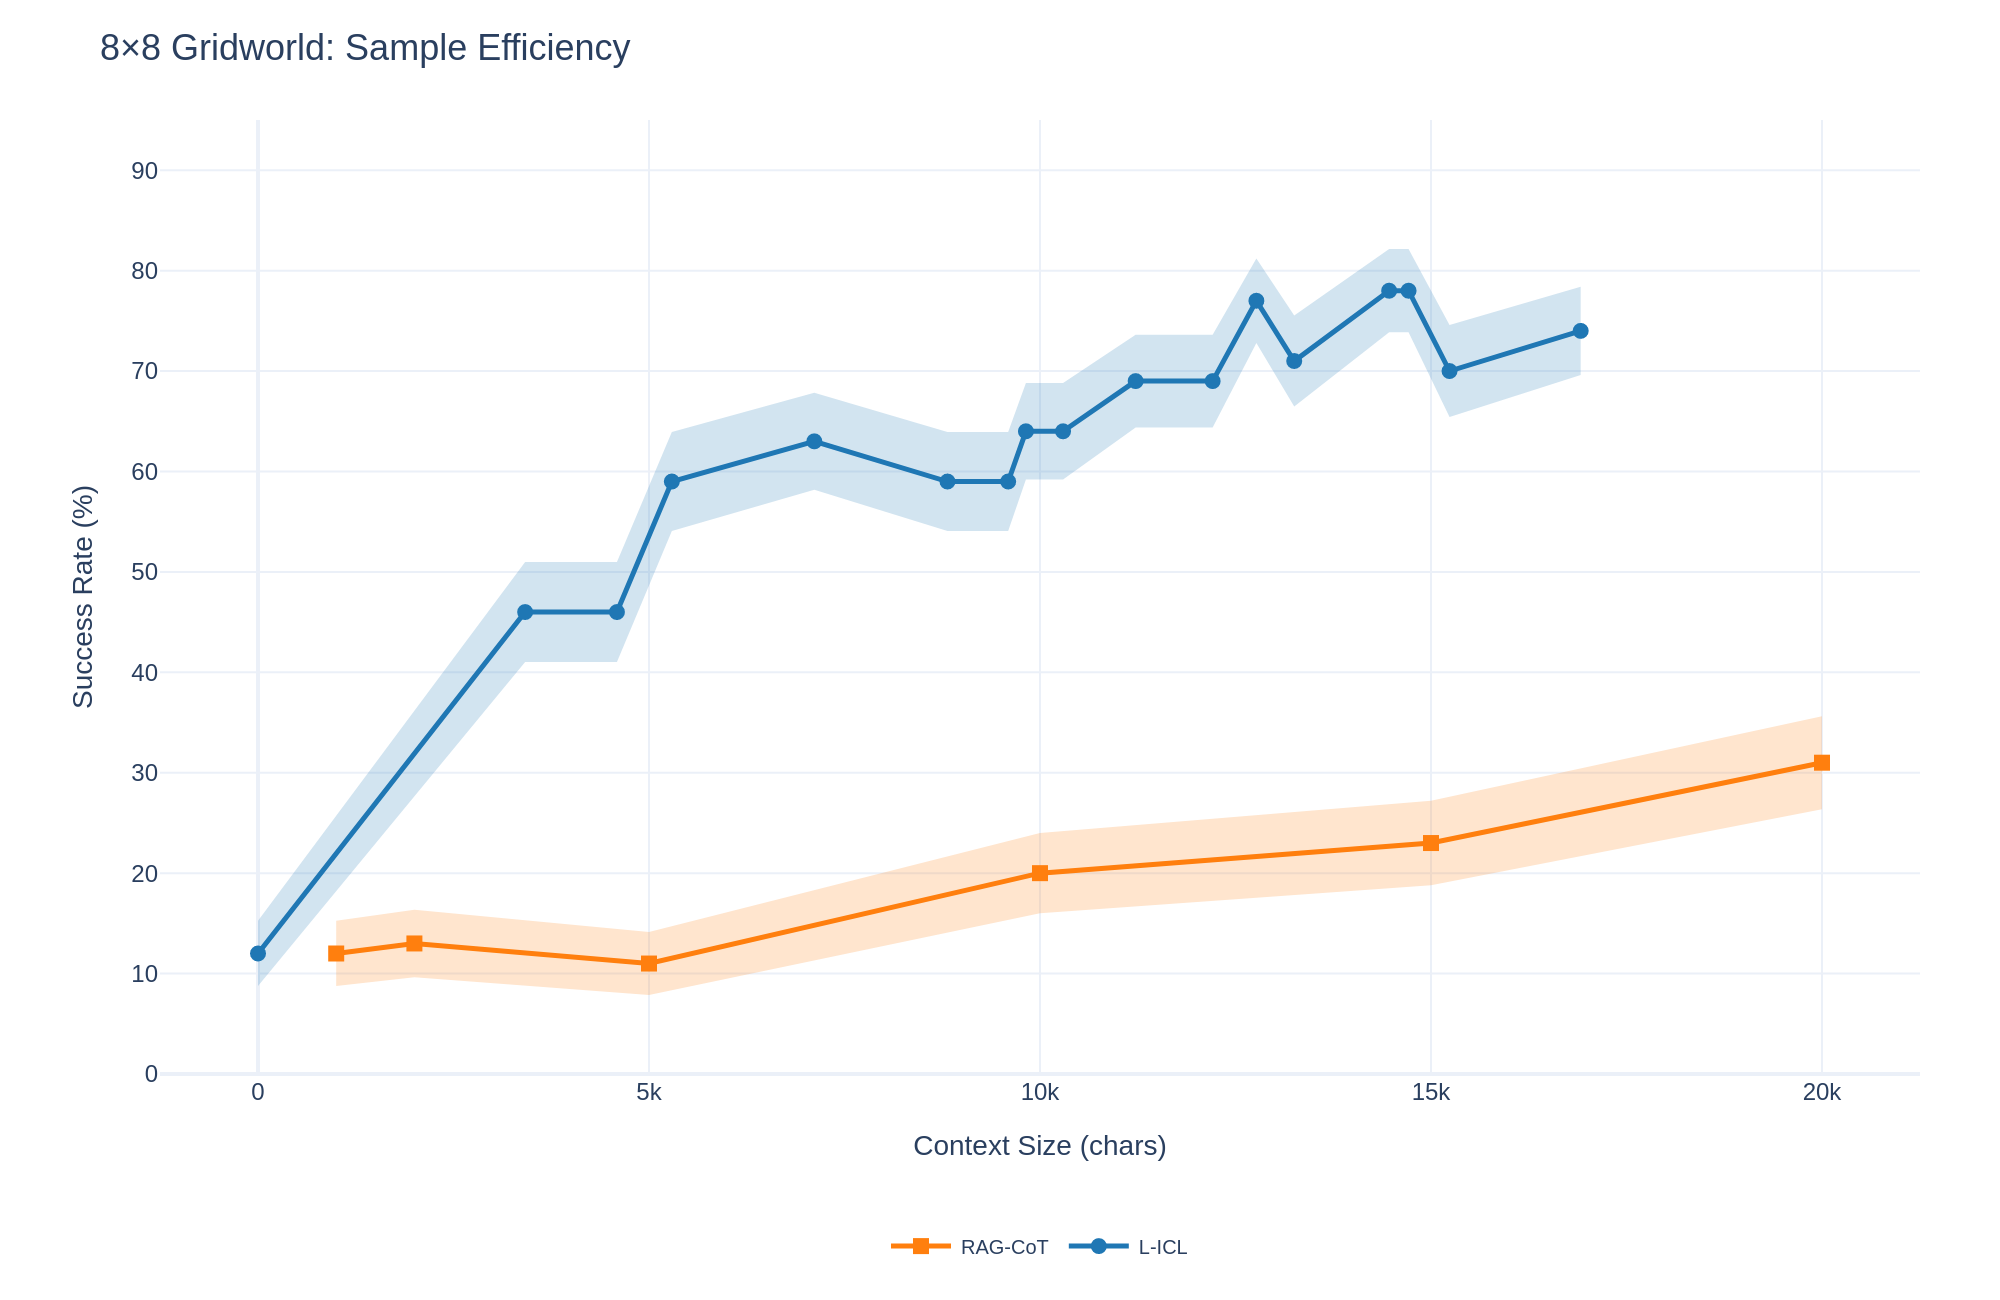
The image is a line chart comparing the sample efficiency of two methods, "RAG-CoT" and "L-ICL," in an 8x8 Gridworld environment. The chart plots the success rate (in percentage) against the context size (in characters). Both lines include shaded regions representing confidence intervals or variance.
### Components/Axes
* **Title:** "8×8 Gridworld: Sample Efficiency" (Top-left, dark blue text).
* **Y-Axis:** Labeled "Success Rate (%)". The scale runs from 0 to 90, with major gridlines at intervals of 10 (0, 10, 20, 30, 40, 50, 60, 70, 80, 90).
* **X-Axis:** Labeled "Context Size (chars)". The scale has labeled tick marks at 0, 5k, 10k, 15k, and 20k. The "k" denotes thousands.
* **Legend:** Positioned at the bottom center of the chart.
* **RAG-CoT:** Represented by an orange line with square markers (■).
* **L-ICL:** Represented by a blue line with circular markers (●).
* **Data Series:** Two lines with associated shaded confidence bands.
* **L-ICL (Blue Line):** Starts low, rises steeply, then continues a generally upward but more variable trend.
* **RAG-CoT (Orange Line):** Starts low, shows a slight initial dip, then follows a slow, steady upward trend.
### Detailed Analysis
**L-ICL (Blue Line with Circles):**
* **Trend:** Shows a rapid initial improvement followed by a continued, though more volatile, upward trend. The confidence band (light blue shading) is relatively wide, indicating higher variance in performance.
* **Approximate Data Points:**
* At 0 chars: ~12% success rate.
* At ~3.5k chars: ~46%.
* At 5k chars: ~46%.
* At ~7k chars: ~63%.
* At ~9k chars: ~59%.
* At ~10k chars: ~64%.
* At ~11.5k chars: ~69%.
* At ~12.5k chars: ~69%.
* At ~13.5k chars: ~77% (local peak).
* At ~14k chars: ~71%.
* At ~15k chars: ~78% (highest point on the chart).
* At ~15.5k chars: ~78%.
* At ~16k chars: ~70%.
* At ~17k chars: ~74%.
**RAG-CoT (Orange Line with Squares):**
* **Trend:** Shows a very gradual, almost linear increase after an initial plateau/dip. The confidence band (light orange shading) is narrower than L-ICL's, suggesting more consistent but lower performance.
* **Approximate Data Points:**
* At ~1k chars: ~12%.
* At ~2k chars: ~13%.
* At 5k chars: ~11% (slight dip).
* At 10k chars: ~20%.
* At 15k chars: ~23%.
* At 20k chars: ~31%.
### Key Observations
1. **Performance Gap:** L-ICL consistently and significantly outperforms RAG-CoT across all measured context sizes greater than zero. The gap widens as context size increases.
2. **Efficiency:** L-ICL achieves a high success rate (~46%) with a relatively small context size (~3.5k chars), whereas RAG-CoT requires the full 20k chars to reach just ~31%.
3. **Volatility vs. Stability:** L-ICL's performance is more volatile (evidenced by the jagged line and wider confidence band), while RAG-CoT's improvement is slow and stable.
4. **Peak Performance:** The highest success rate shown is approximately 78% by L-ICL at a context size of around 15k chars.
### Interpretation
The data demonstrates a clear advantage for the L-ICL method over RAG-CoT in terms of sample efficiency for the 8x8 Gridworld task. L-ICL learns much faster from the provided context, reaching high performance levels with less data. However, its performance is less predictable, as shown by the larger confidence intervals. RAG-CoT, while more stable, is significantly less efficient, requiring substantially more context to achieve modest gains.
This suggests that for this specific task, leveraging in-context learning (L-ICL) is a more powerful approach than the retrieval-augmented chain-of-thought (RAG-CoT) method, especially when context window size is a resource to be optimized. The volatility in L-ICL might indicate sensitivity to the specific examples retrieved or the ordering within the context. The chart implies a trade-off: choose L-ICL for higher potential performance and efficiency, or RAG-CoT for more predictable, albeit lower, returns.