\n
## Chart: Importance Score vs. Reasoning Step
### Overview
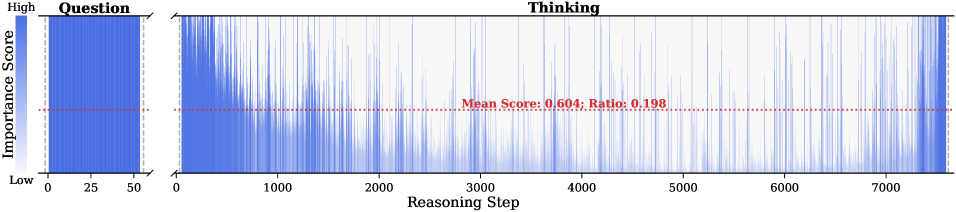
The image presents a chart visualizing the "Importance Score" over "Reasoning Step". The chart appears to represent a process divided into two phases: "Question" and "Thinking". The Importance Score fluctuates significantly during the "Thinking" phase, while it is relatively high and stable during the "Question" phase. A horizontal dashed line indicates the mean Importance Score and Ratio.
### Components/Axes
* **X-axis:** "Reasoning Step", ranging from 0 to approximately 7500.
* **Y-axis:** "Importance Score", labeled with "High" at the top and "Low" at the bottom. The scale is not numerically defined, but appears to be a relative scale.
* **Chart Title:** Not explicitly present, but the chart represents the relationship between Reasoning Step and Importance Score.
* **Phases:** The chart is divided into two sections labeled "Question" (from 0 to approximately 50 Reasoning Steps) and "Thinking" (from approximately 50 to 7500 Reasoning Steps).
* **Mean Score Line:** A horizontal dashed red line spanning the entire chart, labeled "Mean Score: 0.604; Ratio: 0.198".
### Detailed Analysis
The "Question" phase (0-50 Reasoning Steps) shows a consistently high Importance Score, represented by a solid blue bar. The score appears to be near the "High" end of the Y-axis.
The "Thinking" phase (50-7500 Reasoning Steps) exhibits a highly variable Importance Score. The score fluctuates rapidly, crossing the mean score line (0.604) numerous times.
* **Initial Drop:** Immediately after the "Question" phase, the Importance Score drops sharply.
* **Fluctuations:** Throughout the "Thinking" phase, the score oscillates between low and moderate levels. There are periods where the score rises above the mean, but it generally remains below the level observed in the "Question" phase.
* **No Clear Trend:** There is no discernible upward or downward trend in the Importance Score during the "Thinking" phase. It appears largely random.
### Key Observations
* The Importance Score is significantly higher during the "Question" phase compared to the "Thinking" phase.
* The "Thinking" phase is characterized by high variability in the Importance Score.
* The mean Importance Score is 0.604, and the Ratio is 0.198.
* The transition from "Question" to "Thinking" is marked by a sudden decrease in Importance Score.
### Interpretation
This chart likely represents the cognitive process of problem-solving or decision-making. The "Question" phase represents the initial understanding of the problem, where the importance of information is high and focused. The "Thinking" phase represents the exploration of potential solutions, where the importance of individual reasoning steps fluctuates as different ideas are considered and evaluated.
The high variability in the "Thinking" phase suggests that the process is exploratory and involves a lot of trial and error. The lower average Importance Score during this phase indicates that many reasoning steps are not directly relevant to the final solution. The ratio of 0.198 could represent the proportion of important reasoning steps within the "Thinking" phase.
The sharp drop in Importance Score at the transition from "Question" to "Thinking" suggests a shift in cognitive focus from understanding the problem to generating potential solutions. This could be interpreted as a necessary step in the problem-solving process, where the initial clarity of the problem is replaced by the uncertainty of exploration.