## Heatmap: Importance Scores Across Reasoning Steps
### Overview
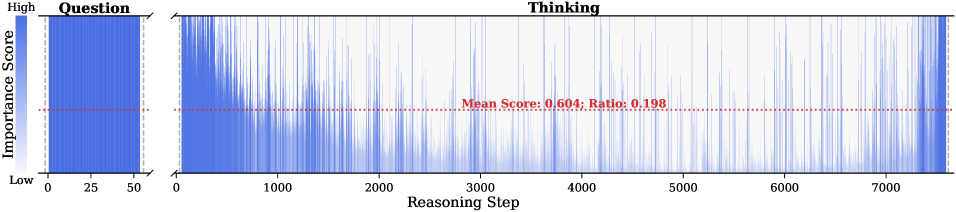
The image displays a heatmap visualizing importance scores across reasoning steps, divided into two sections: "Question" (left) and "Thinking" (right). A red dashed line labeled with a mean score (0.604) and ratio (0.198) spans the chart horizontally. The y-axis represents importance scores (Low to High), while the x-axis tracks reasoning steps (0–7000).
### Components/Axes
- **Y-Axis (Importance Score)**:
- Labeled "Importance Score" with a gradient from white (Low) to blue (High).
- A horizontal red dashed line at ~0.604 marks the mean score.
- **X-Axis (Reasoning Step)**:
- Labeled "Reasoning Step" with a linear scale from 0 to 7000.
- **Legend**:
- Positioned on the left, with blue representing "High" importance and white representing "Low" importance.
- **Embedded Text**:
- "Mean Score: 0.604; Ratio: 0.198" in red text on the red dashed line.
### Detailed Analysis
- **Question Section (Left)**:
- A solid blue vertical bar spans the entire y-axis, indicating consistently high importance scores for the question.
- **Thinking Section (Right)**:
- A grid of vertical blue lines with varying opacity, suggesting fluctuating importance scores across reasoning steps.
- Most lines are faint (low importance), with occasional dense clusters of darker blue (high importance).
- **Red Dashed Line**:
- Positioned centrally, intersecting the x-axis at ~3500 reasoning steps.
- Annotated with "Mean Score: 0.604" (median importance) and "Ratio: 0.198" (proportion of high-importance steps).
### Key Observations
1. **Question Dominance**: The question section shows uniform high importance, contrasting with the variability in the thinking section.
2. **Thinking Variability**: The thinking section exhibits sporadic high-importance steps (dark blue lines) but no clear trend.
3. **Mean vs. Ratio**: The mean score (0.604) is moderate, but the low ratio (0.198) indicates that high-importance steps are rare in the thinking process.
4. **Red Line Placement**: The red dashed line’s central position suggests the average importance score is mid-range, but the ratio highlights a skewed distribution toward low importance.
### Interpretation
- **Data Implications**: The chart demonstrates that the model prioritizes the question over the reasoning process. While the question consistently receives high importance, the thinking steps are mostly low-importance, with only occasional critical steps (dark blue lines).
- **Trend Verification**: The thinking section’s lack of a clear upward/downward trend confirms the sporadic nature of high-importance steps. The red line’s central placement aligns with the mean score but does not reflect the low ratio, indicating a bimodal distribution.
- **Anomalies**: The stark contrast between the question’s uniformity and the thinking section’s variability suggests potential inefficiencies in reasoning step prioritization. The low ratio (0.198) implies most reasoning steps are deemed unimportant, which may warrant optimization.