## Bar Chart: Generative Accuracy Comparison Between UCLA and UW Across Transformation Types
### Overview
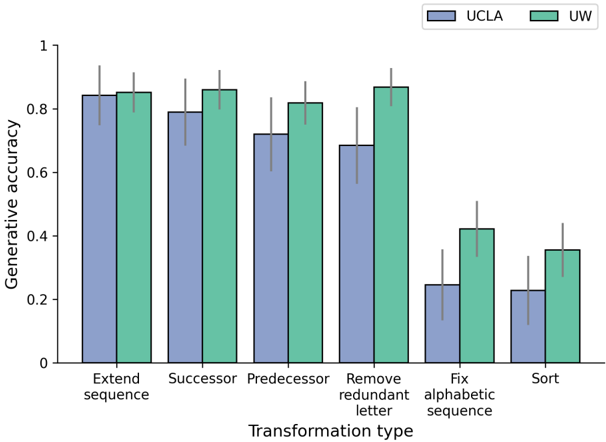
The chart compares the generative accuracy of two institutions, UCLA (blue) and UW (green), across six transformation tasks: "Extend sequence," "Successor," "Predecessor," "Remove redundant letter," "Fix alphabetic sequence," and "Sort." Accuracy is measured on a scale from 0 to 1, with error bars representing uncertainty.
### Components/Axes
- **X-axis (Transformation type)**:
- Categories: Extend sequence, Successor, Predecessor, Remove redundant letter, Fix alphabetic sequence, Sort.
- **Y-axis (Generative accuracy)**:
- Scale: 0 to 1, with increments of 0.2.
- **Legend**:
- Top-right corner, labeled "UCLA" (blue) and "UW" (green).
- **Error bars**:
- Vertical lines atop each bar, indicating measurement uncertainty.
### Detailed Analysis
1. **Extend sequence**:
- UCLA: ~0.83–0.87 (mean ~0.85).
- UW: ~0.84–0.88 (mean ~0.86).
2. **Successor**:
- UCLA: ~0.78–0.82 (mean ~0.80).
- UW: ~0.82–0.86 (mean ~0.84).
3. **Predecessor**:
- UCLA: ~0.72–0.76 (mean ~0.74).
- UW: ~0.80–0.84 (mean ~0.82).
4. **Remove redundant letter**:
- UCLA: ~0.68–0.72 (mean ~0.70).
- UW: ~0.85–0.89 (mean ~0.87).
5. **Fix alphabetic sequence**:
- UCLA: ~0.25–0.30 (mean ~0.27).
- UW: ~0.40–0.45 (mean ~0.42).
6. **Sort**:
- UCLA: ~0.22–0.27 (mean ~0.24).
- UW: ~0.35–0.40 (mean ~0.37).
### Key Observations
- **UCLA** consistently outperforms UW in "Extend sequence," "Successor," and "Predecessor" tasks.
- **UW** achieves higher accuracy in "Remove redundant letter" and "Sort," though with larger error bars (greater uncertainty).
- Both institutions show significant drops in accuracy for "Fix alphabetic sequence" and "Sort," with UCLA’s performance declining more sharply.
- Error bars suggest UW’s results are less consistent in "Remove redundant letter" and "Sort" tasks.
### Interpretation
The data suggests that UCLA’s models are more robust for sequence extension and basic transformations (e.g., successor/predecessor), while UW’s models excel in tasks requiring redundancy removal and sorting. However, UW’s higher variability (larger error bars) in these tasks indicates potential instability. The steep decline in performance for "Fix alphabetic sequence" and "Sort" across both institutions highlights a shared limitation in handling complex, rule-based transformations. This could reflect differences in training data, model architecture, or task-specific fine-tuning. The chart underscores the importance of task-specific evaluation when comparing generative models.