## Bar Chart: Generative Accuracy by Transformation Type
### Overview
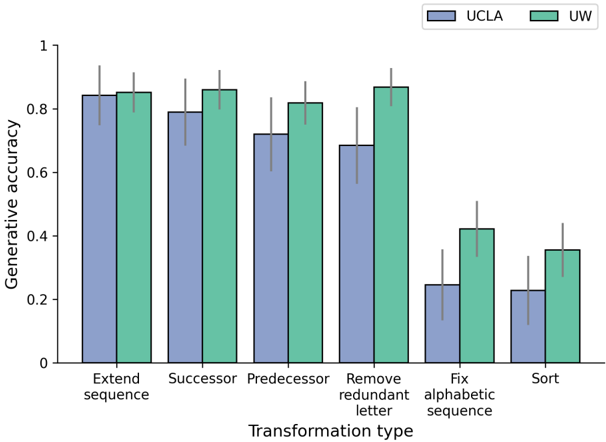
The image is a bar chart comparing the generative accuracy of two entities, UCLA and UW, across six different transformation types. The chart displays the mean accuracy for each transformation type, with error bars indicating the variability.
### Components/Axes
* **X-axis:** Transformation type, with categories: "Extend sequence", "Successor", "Predecessor", "Remove redundant letter", "Fix alphabetic sequence", and "Sort".
* **Y-axis:** Generative accuracy, ranging from 0 to 1.0, with tick marks at intervals of 0.2.
* **Legend:** Located at the top-right of the chart.
* UCLA: Represented by light blue bars.
* UW: Represented by light green bars.
### Detailed Analysis
The chart presents a comparison of generative accuracy between UCLA (light blue) and UW (light green) for different transformation types. Error bars are present on each bar, indicating the standard deviation or standard error.
* **Extend sequence:** UCLA has an accuracy of approximately 0.84 +/- 0.05, while UW has an accuracy of approximately 0.85 +/- 0.05.
* **Successor:** UCLA has an accuracy of approximately 0.79 +/- 0.10, while UW has an accuracy of approximately 0.86 +/- 0.05.
* **Predecessor:** UCLA has an accuracy of approximately 0.73 +/- 0.10, while UW has an accuracy of approximately 0.82 +/- 0.05.
* **Remove redundant letter:** UCLA has an accuracy of approximately 0.69 +/- 0.10, while UW has an accuracy of approximately 0.86 +/- 0.05.
* **Fix alphabetic sequence:** UCLA has an accuracy of approximately 0.25 +/- 0.05, while UW has an accuracy of approximately 0.42 +/- 0.10.
* **Sort:** UCLA has an accuracy of approximately 0.23 +/- 0.10, while UW has an accuracy of approximately 0.36 +/- 0.10.
### Key Observations
* UW generally outperforms UCLA across all transformation types.
* The "Fix alphabetic sequence" and "Sort" transformation types have the lowest generative accuracy for both UCLA and UW.
* The "Extend sequence", "Successor", "Predecessor", and "Remove redundant letter" transformation types have the highest generative accuracy for both UCLA and UW.
* The error bars suggest that the difference in performance between UCLA and UW is statistically significant for some transformation types, but not for others.
### Interpretation
The bar chart illustrates the generative accuracy of UCLA and UW across various transformation types. The data suggests that UW generally performs better than UCLA in these tasks. The lower accuracy for "Fix alphabetic sequence" and "Sort" indicates that these transformations are more challenging for both entities. The error bars provide a measure of the variability in the data, which is important for assessing the statistical significance of the observed differences. The chart provides a visual comparison of the performance of UCLA and UW, highlighting their strengths and weaknesses in different transformation tasks.