## Grouped Bar Chart: Generative Accuracy by Transformation Type
### Overview
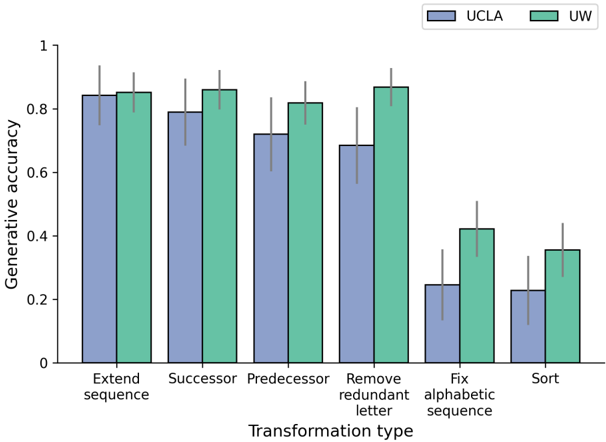
This is a grouped bar chart comparing the "Generative accuracy" of two entities, labeled "UCLA" and "UW", across six different "Transformation type" categories. The chart includes error bars for each data point, indicating variability or confidence intervals. The overall trend shows a decrease in accuracy for both groups as the transformation tasks become more complex, with UCLA's performance declining more sharply than UW's.
### Components/Axes
* **Chart Type:** Grouped bar chart with error bars.
* **Y-Axis:**
* **Label:** "Generative accuracy"
* **Scale:** Linear, from 0 to 1, with major tick marks at 0, 0.2, 0.4, 0.6, 0.8, and 1.
* **X-Axis:**
* **Label:** "Transformation type"
* **Categories (from left to right):**
1. Extend sequence
2. Successor
3. Predecessor
4. Remove redundant letter
5. Fix alphabetic sequence
6. Sort
* **Legend:** Located in the top-right corner of the chart area.
* **UCLA:** Represented by blue bars.
* **UW:** Represented by green bars.
### Detailed Analysis
The following table reconstructs the approximate data values and trends. Values are estimated from the bar heights relative to the y-axis. Error bar ranges are approximate visual estimates.
| Transformation Type | UCLA (Blue) Accuracy (Approx.) | UCLA Error Range (Approx.) | UW (Green) Accuracy (Approx.) | UW Error Range (Approx.) | Visual Trend |
| :--- | :--- | :--- | :--- | :--- | :--- |
| **Extend sequence** | 0.84 | 0.75 - 0.93 | 0.85 | 0.78 - 0.92 | Both groups perform similarly and at their highest level. |
| **Successor** | 0.79 | 0.68 - 0.90 | 0.86 | 0.78 - 0.94 | UW slightly outperforms UCLA. |
| **Predecessor** | 0.72 | 0.60 - 0.84 | 0.82 | 0.74 - 0.90 | UW maintains high accuracy; UCLA shows a noticeable drop. |
| **Remove redundant letter** | 0.69 | 0.57 - 0.81 | 0.87 | 0.80 - 0.94 | UW's accuracy peaks here; UCLA continues to decline. |
| **Fix alphabetic sequence** | 0.24 | 0.13 - 0.35 | 0.42 | 0.34 - 0.50 | **Major drop for both.** UCLA's accuracy plummets. UW's accuracy is halved. |
| **Sort** | 0.23 | 0.12 - 0.34 | 0.36 | 0.27 - 0.45 | Lowest performance for both groups. UCLA and UW show similar low accuracy. |
### Key Observations
1. **Performance Gap:** UW consistently outperforms UCLA across all transformation types. The gap is smallest for the initial tasks ("Extend sequence", "Successor") and largest for the more complex tasks ("Remove redundant letter", "Fix alphabetic sequence").
2. **Task Complexity Trend:** There is a clear downward trend in accuracy for both groups as the transformation tasks progress from left to right. The first four tasks ("Extend sequence" through "Remove redundant letter") show relatively high accuracy (>0.69 for UCLA, >0.82 for UW). The final two tasks ("Fix alphabetic sequence" and "Sort") represent a significant drop in performance for both.
3. **UCLA's Decline:** UCLA's accuracy shows a steady, monotonic decrease across the first five categories, with a particularly steep drop between "Remove redundant letter" and "Fix alphabetic sequence".
4. **UW's Resilience:** UW's accuracy remains high and stable (between ~0.82 and ~0.87) for the first four tasks before dropping sharply for the last two.
5. **Error Bars:** The error bars are substantial for all data points, indicating significant variability in the results. The overlap between UCLA and UW error bars is minimal for the first four tasks but increases for the last two, suggesting less statistical certainty in the performance difference for the hardest tasks.
### Interpretation
This chart likely presents results from a study comparing two models or systems (UCLA and UW) on a suite of symbolic or algorithmic reasoning tasks involving sequence manipulation.
* **What the data suggests:** The "UW" system demonstrates superior and more robust performance on generative tasks involving sequence transformations, especially on tasks of moderate complexity. The "UCLA" system's performance degrades more rapidly as task complexity increases.
* **How elements relate:** The x-axis represents an assumed gradient of task difficulty. The consistent performance gap suggests fundamental differences in how the two systems handle these transformations. The sharp drop for both on "Fix alphabetic sequence" and "Sort" indicates these tasks are qualitatively more difficult, possibly requiring global understanding or more complex operations than the earlier, more local transformations.
* **Notable anomalies:** The peak performance for UW on "Remove redundant letter" is interesting, as it slightly exceeds its accuracy on the seemingly simpler "Successor" and "Predecessor" tasks. This could be an outlier or indicate a specific strength of the UW system.
* **Underlying meaning:** The data implies that while both systems can handle basic sequence extensions and successor/predecessor lookups, their capabilities diverge significantly on tasks requiring error correction ("Fix alphabetic sequence") or global ordering ("Sort"). This could reflect differences in training data, model architecture, or the underlying algorithms used for generation. The large error bars suggest the tasks may have high variance or the evaluation metric is sensitive.