## Flowchart Diagram: GSM8K Response Evaluation Pipeline
### Overview
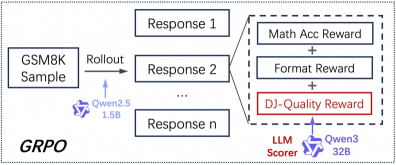
The diagram illustrates a technical workflow for evaluating responses generated from GSM8K samples using a rollout process. It shows the flow of data from initial samples through multiple response generations, reward calculations, and final scoring by an LLM scorer. Key components include response generation, reward aggregation, and model scoring.
### Components/Axes
1. **Input**:
- "GSM8K Sample" (leftmost box)
- "Rollout" arrow connecting to response generation
2. **Response Generation**:
- Multiple response boxes labeled "Response 1", "Response 2", ..., "Response n"
3. **Reward Calculation**:
- Dashed box containing:
- "Math Acc Reward" (Math Accuracy Reward)
- "Format Reward"
- "DJ-Quality Reward" (highlighted in red)
- All rewards are summed together
4. **Output**:
- "LLM Scorer" (Qwen3 32B) receiving aggregated rewards
5. **Additional Elements**:
- "Qwen2.5 1.5B" model mentioned near the rollout arrow
- "GRPO" label at the bottom-left corner
### Detailed Analysis
- **Flow Direction**:
- Left-to-right flow from GSM8K Sample → Rollout → Response Generation → Reward Calculation → LLM Scoring
- **Key Connections**:
- All responses (1 to n) feed into the same reward calculation box
- Reward components are connected via "+" operators
- Final reward sum connects to Qwen3 32B scorer
- **Color Coding**:
- DJ-Quality Reward box is highlighted in red (no legend present)
- Qwen2.5 and Qwen3 models use blue icons with white text
### Key Observations
1. The pipeline emphasizes iterative response generation ("Response n" suggests multiple attempts)
2. DJ-Quality Reward is visually emphasized (red box) suggesting it's a critical evaluation metric
3. Qwen3 32B is positioned as the final scorer, while Qwen2.5 1.5B appears in the rollout phase
4. GRPO (possibly a training method) is labeled but not connected to any specific component
### Interpretation
This diagram represents a multi-stage evaluation system for mathematical reasoning models. The GSM8K samples (likely math problems) undergo a rollout process generating multiple responses, which are then evaluated across three dimensions: mathematical accuracy, formatting quality, and domain-specific quality (DJ-Quality). The red highlighting of DJ-Quality Reward implies this metric may carry special importance in the evaluation process. The use of different Qwen model sizes (1.5B vs 32B) suggests a hierarchy where smaller models handle initial response generation while larger models perform final scoring. The GRPO label hints at potential reinforcement learning optimization in the pipeline, though its exact role isn't specified in the diagram.