# Technical Document Extraction: Graph Analysis
## Graph (c)
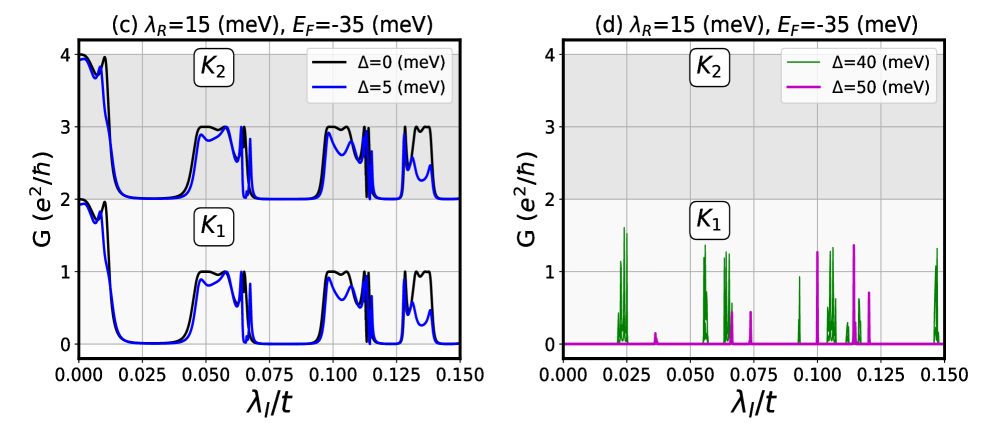
**Title**: `(c) λ_R=15 (meV), E_F=-35 (meV)`
**X-axis**: `λ_I/t` (ranging from 0.000 to 0.150)
**Y-axis**: `G (e²/h)` (ranging from 0 to 4)
### Legend
- `Δ=0 (meV)`: Black line
- `Δ=5 (meV)`: Blue line
### Key Observations
- **K1** and **K2** labels marked in boxes at specific λ_I/t positions.
- **Δ=0 (black line)**:
- Sharp peaks at λ_I/t ≈ 0.025, 0.075, 0.125 (K1 and K2 regions).
- Conductance (G) reaches ~4 e²/h at these peaks.
- **Δ=5 (blue line)**:
- Peaks slightly broadened and shifted compared to Δ=0.
- Reduced conductance magnitude (~3 e²/h) at K1/K2 regions.
---
## Graph (d)
**Title**: `(d) λ_R=15 (meV), E_F=-35 (meV)`
**X-axis**: `λ_I/t` (ranging from 0.000 to 0.150)
**Y-axis**: `G (e²/h)` (ranging from 0 to 4)
**Shaded Region**: Gray area between 0 and 2 e²/h on the y-axis.
### Legend
- `Δ=40 (meV)`: Green line
- `Δ=50 (meV)`: Pink line
### Key Observations
- **K1** label marked in a box at a specific λ_I/t position.
- **Δ=40 (green line)**:
- Multiple narrow peaks at λ_I/t ≈ 0.025, 0.05, 0.075, 0.1, 0.125.
- Conductance (G) reaches ~1.5–2 e²/h at these peaks.
- **Δ=50 (pink line)**:
- Peaks are sharper and more pronounced than Δ=40.
- Conductance (G) reaches ~1–1.5 e²/h at K1 region.
- Additional peaks observed at λ_I/t ≈ 0.075 and 0.125.
---
## Cross-Reference Summary
| Legend Label | Color | Graph | Conductance Behavior |
|--------------|-------|-------|----------------------|
| Δ=0 (meV) | Black | (c) | Sharp, high peaks at K1/K2 |
| Δ=5 (meV) | Blue | (c) | Broadened, lower peaks at K1/K2 |
| Δ=40 (meV) | Green | (d) | Multiple narrow peaks, moderate G |
| Δ=50 (meV) | Pink | (d) | Sharper peaks, localized at K1 |
**Note**: Both graphs share identical λ_R and E_F parameters. The shaded region in (d) highlights a baseline conductance range (0–2 e²/h), potentially indicating a threshold for significant conductance features.