## Line Graphs: Event Size Probability Distributions
### Overview
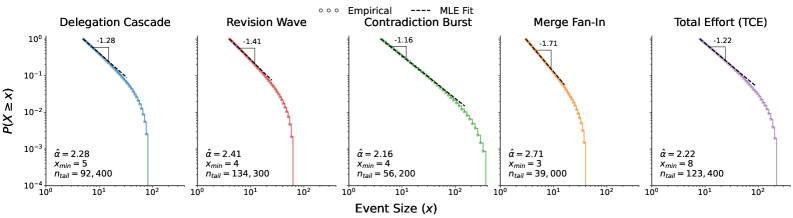
The image contains five horizontally aligned line graphs, each depicting the probability distribution of event sizes for different network phenomena. All graphs use a log-log scale, with event size (x) on the x-axis and probability (P(X ≥ x)) on the y-axis. Each graph includes a fitted power-law curve (dashed line) and empirical data points (dots), with parameters like slope (α), minimum event size (x_min), and tail count (n_tail) labeled.
---
### Components/Axes
- **X-axis**: "Event Size (x)" (log scale, 10⁰ to 10²)
- **Y-axis**: "P(X ≥ x)" (log scale, 10⁻⁴ to 10⁰)
- **Legends**: Positioned at the top-right of each graph, labeled "Empirical" (dots) and "MLE Fit" (dashed line).
- **Graph Titles**:
1. Delegation Cascade
2. Revision Wave
3. Contradiction Burst
4. Merge Fan-In
5. Total Effort (TCE)
- **Parameter Labels**:
- Slope (α) in bottom-left (e.g., α = 2.28)
- x_min (minimum event size)
- n_tail (tail event count)
---
### Detailed Analysis
1. **Delegation Cascade** (Blue)
- Slope (α): -1.28
- x_min: 5
- n_tail: 92,400
- Trend: Gradual decay with a moderate slope.
2. **Revision Wave** (Red)
- Slope (α): -1.41
- x_min: 4
- n_tail: 134,300
- Trend: Steeper decay than Delegation Cascade.
3. **Contradiction Burst** (Green)
- Slope (α): -1.16
- x_min: 4
- n_tail: 56,200
- Trend: Shallowest decay among all graphs.
4. **Merge Fan-In** (Orange)
- Slope (α): -1.71
- x_min: 3
- n_tail: 39,000
- Trend: Sharpest decay, indicating rapid probability drop-off.
5. **Total Effort (TCE)** (Purple)
- Slope (α): -1.22
- x_min: 8
- n_tail: 123,400
- Trend: Moderate decay with the highest x_min.
---
### Key Observations
- **Slope Variance**: Merge Fan-In has the steepest slope (-1.71), suggesting the fastest decay in probability with increasing event size. Contradiction Burst has the shallowest slope (-1.16), indicating slower decay.
- **x_min Differences**: Total Effort (x_min = 8) has the largest minimum event size, while Merge Fan-In (x_min = 3) has the smallest.
- **Tail Counts**: Total Effort has the highest n_tail (123,400), implying a heavier tail distribution compared to others.
---
### Interpretation
The graphs reveal distinct behavioral patterns for different network phenomena:
- **Merge Fan-In** exhibits the most rapid decay (steepest slope), suggesting events of this type are less likely to occur at larger sizes.
- **Contradiction Burst** shows the slowest decay, implying a higher likelihood of large events persisting.
- **Total Effort (TCE)** has the largest minimum event size (x_min = 8), indicating it primarily affects larger-scale events.
- The **n_tail** values correlate with the tail distribution's heaviness: higher n_tail values (e.g., Total Effort) suggest more extreme tail behavior.
These results highlight how different network processes exhibit unique size-distribution characteristics, with implications for modeling and predicting event cascades in complex systems.