## Bar Chart: Model Performance Comparison
### Overview
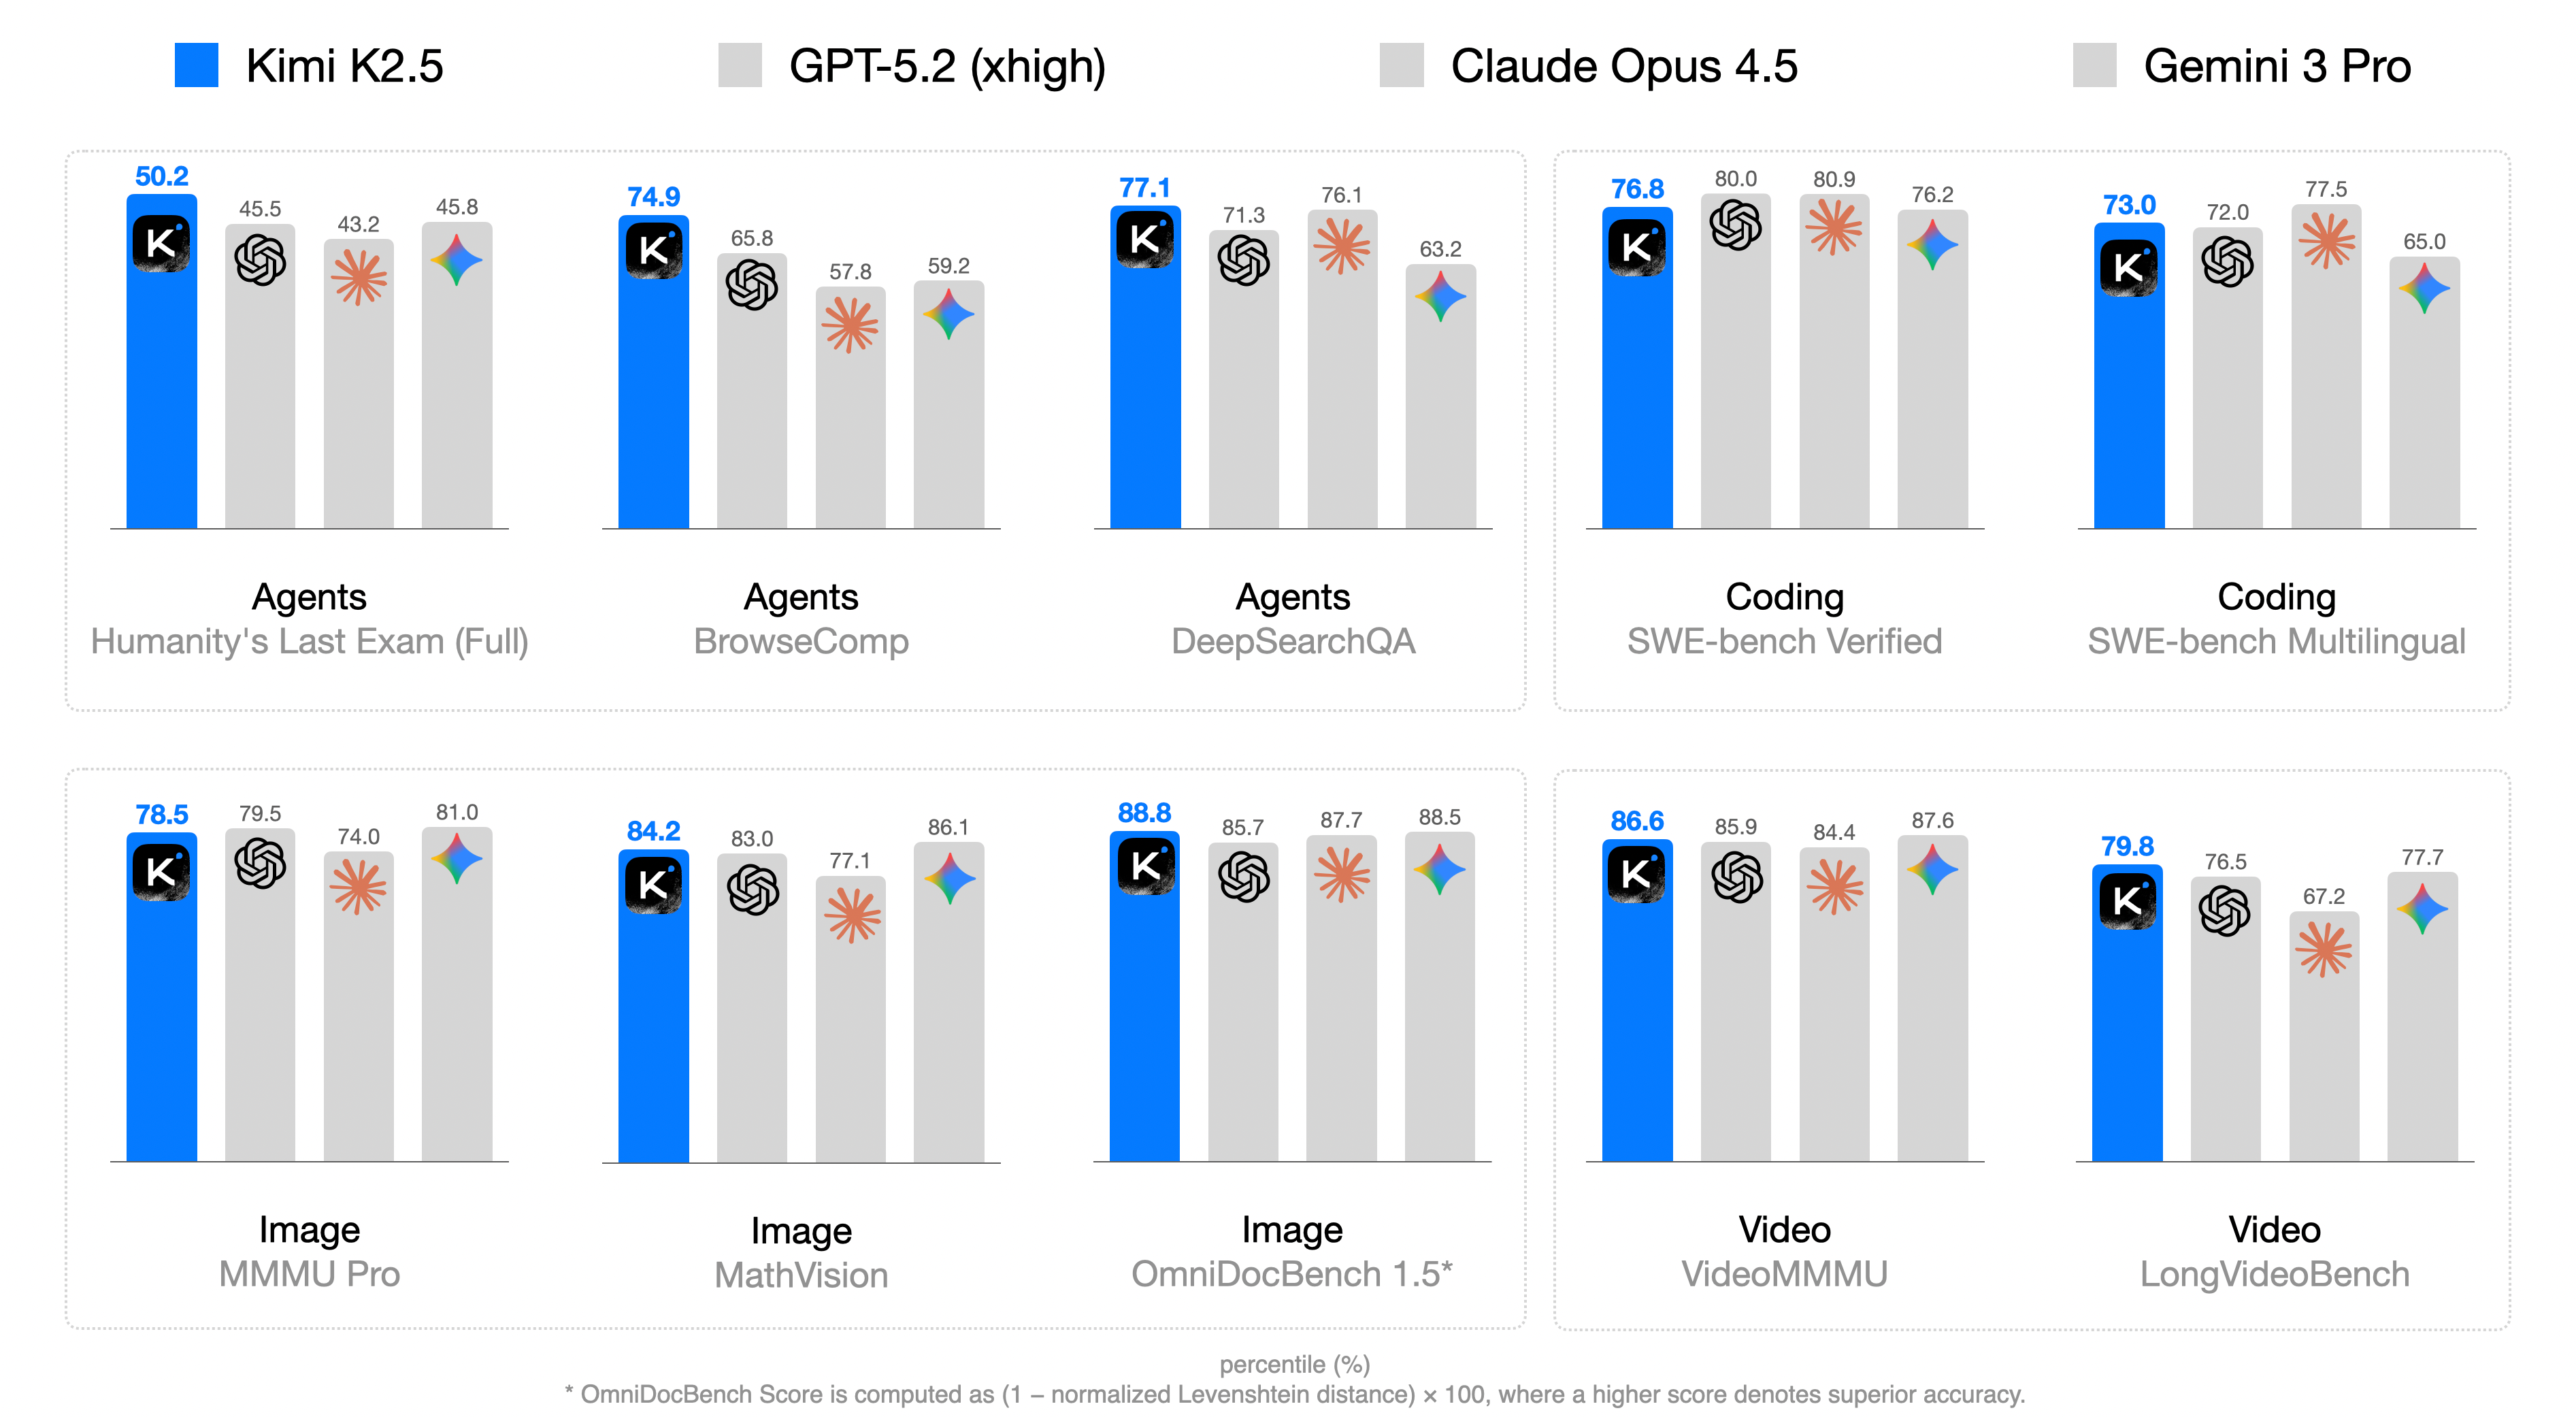
The image presents a bar chart comparing the performance of four AI models (Kimi K2.5, GPT-5.2 (xhigh), Claude Opus 4.5, and Gemini 3 Pro) across various tasks categorized as Agents, Coding, Image, and Video. The chart displays percentile scores for each model on specific benchmarks within these categories.
### Components/Axes
* **Title:** Model Performance Comparison (inferred)
* **X-Axis:** Categorical, representing different tasks and benchmarks:
* Agents: Humanity's Last Exam (Full), BrowseComp, DeepSearchQA
* Coding: SWE-bench Verified, SWE-bench Multilingual
* Image: MMMU Pro, MathVision, OmniDocBench 1.5*
* Video: VideoMMMU, LongVideoBench
* **Y-Axis:** Percentile (%) - Numerical scale from approximately 0 to 100 (inferred).
* **Legend:** Located at the top of the chart.
* Blue: Kimi K2.5
* Light Gray: GPT-5.2 (xhigh)
* Dark Gray: Claude Opus 4.5
* Lighter Gray: Gemini 3 Pro
* **Bars:** Represent the percentile scores of each model on each benchmark. The height of the bar corresponds to the percentile score.
* **Icons:** Each model has an associated icon above its bar.
* Kimi K2.5: "K" in a rounded square
* GPT-5.2 (xhigh): A swirling shape
* Claude Opus 4.5: An asterisk-like shape
* Gemini 3 Pro: A multi-colored diamond shape
### Detailed Analysis
**Agents**
* **Humanity's Last Exam (Full):**
* Kimi K2.5 (Blue): 50.2
* GPT-5.2 (xhigh) (Light Gray): 45.5
* Claude Opus 4.5 (Dark Gray): 43.2
* Gemini 3 Pro (Lighter Gray): 45.8
* **BrowseComp:**
* Kimi K2.5 (Blue): 74.9
* GPT-5.2 (xhigh) (Light Gray): 65.8
* Claude Opus 4.5 (Dark Gray): 57.8
* Gemini 3 Pro (Lighter Gray): 59.2
* **DeepSearchQA:**
* Kimi K2.5 (Blue): 77.1
* GPT-5.2 (xhigh) (Light Gray): 71.3
* Claude Opus 4.5 (Dark Gray): 76.1
* Gemini 3 Pro (Lighter Gray): 63.2
**Coding**
* **SWE-bench Verified:**
* Kimi K2.5 (Blue): 76.8
* GPT-5.2 (xhigh) (Light Gray): 80.0
* Claude Opus 4.5 (Dark Gray): 80.9
* Gemini 3 Pro (Lighter Gray): 76.2
* **SWE-bench Multilingual:**
* Kimi K2.5 (Blue): 73.0
* GPT-5.2 (xhigh) (Light Gray): 72.0
* Claude Opus 4.5 (Dark Gray): 77.5
* Gemini 3 Pro (Lighter Gray): 65.0
**Image**
* **MMMU Pro:**
* Kimi K2.5 (Blue): 78.5
* GPT-5.2 (xhigh) (Light Gray): 79.5
* Claude Opus 4.5 (Dark Gray): 74.0
* Gemini 3 Pro (Lighter Gray): 81.0
* **MathVision:**
* Kimi K2.5 (Blue): 84.2
* GPT-5.2 (xhigh) (Light Gray): 83.0
* Claude Opus 4.5 (Dark Gray): 77.1
* Gemini 3 Pro (Lighter Gray): 86.1
* **OmniDocBench 1.5*:**
* Kimi K2.5 (Blue): 88.8
* GPT-5.2 (xhigh) (Light Gray): 85.7
* Claude Opus 4.5 (Dark Gray): 87.7
* Gemini 3 Pro (Lighter Gray): 88.5
**Video**
* **VideoMMMU:**
* Kimi K2.5 (Blue): 86.6
* GPT-5.2 (xhigh) (Light Gray): 85.9
* Claude Opus 4.5 (Dark Gray): 84.4
* Gemini 3 Pro (Lighter Gray): 87.6
* **LongVideoBench:**
* Kimi K2.5 (Blue): 79.8
* GPT-5.2 (xhigh) (Light Gray): 76.5
* Claude Opus 4.5 (Dark Gray): 67.2
* Gemini 3 Pro (Lighter Gray): 77.7
### Key Observations
* Kimi K2.5 (Blue) generally performs well across all tasks, often leading or being competitive with other models.
* GPT-5.2 (xhigh) (Light Gray) shows variable performance, sometimes exceeding Kimi K2.5 but also lagging in other areas.
* Claude Opus 4.5 (Dark Gray) demonstrates consistent performance, usually placing in the middle range.
* Gemini 3 Pro (Lighter Gray) also shows variable performance, with some strong showings and some weaker ones.
* The performance spread varies across different tasks, with some tasks showing closer scores between models than others.
### Interpretation
The bar chart provides a comparative analysis of the four AI models across a range of tasks. The data suggests that Kimi K2.5 is a strong all-around performer, while the other models have their own strengths and weaknesses depending on the specific task. The varying performance across different tasks highlights the importance of benchmarking AI models on a diverse set of evaluations to get a comprehensive understanding of their capabilities. The footnote regarding OmniDocBench indicates that the score calculation involves a normalized Levenshtein distance, suggesting that this particular benchmark focuses on text-based accuracy.