## Chart/Diagram Type: Composite Figure
### Overview
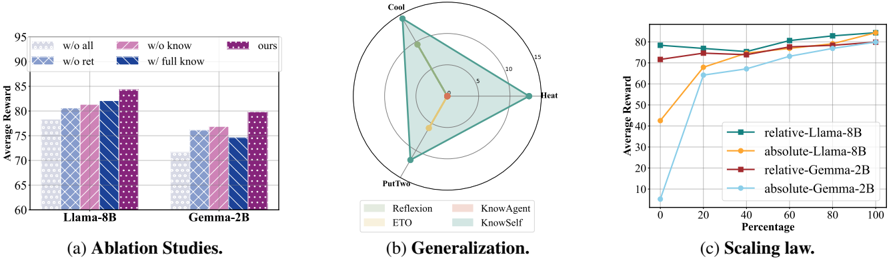
The image presents a composite figure consisting of three subplots: a bar chart showing ablation studies, a radar chart illustrating generalization performance, and a line graph depicting scaling laws. Each subplot explores different aspects of model performance.
### Components/Axes
**Subplot (a): Ablation Studies**
* **Type:** Bar Chart
* **X-axis:** Model Type (Llama-8B, Gemma-2B)
* **Y-axis:** Average Reward, ranging from 60 to 95 in increments of 5.
* **Legend (top-left):**
* `w/o all`: White with diagonal lines from top-left to bottom-right
* `w/o ret`: Light blue with diagonal lines from top-left to bottom-right
* `w/o know`: Light pink with diagonal lines from top-left to bottom-right
* `w/ full know`: Dark blue with diagonal lines from top-left to bottom-right
* `ours`: Purple with diagonal lines from top-left to bottom-right
**Subplot (b): Generalization**
* **Type:** Radar Chart
* **Axes:** Three axes labeled "Cool", "Heat", and "PutTwo".
* **Scale:** Concentric circles representing values from 0 to 15 in increments of 5.
* **Legend (bottom-left):**
* `Reflexion`: Light green
* `ETO`: Light yellow
* `KnowAgent`: Light pink
* `KnowSelf`: Light blue
**Subplot (c): Scaling Law**
* **Type:** Line Graph
* **X-axis:** Percentage, ranging from 0 to 100 in increments of 20.
* **Y-axis:** Average Reward, ranging from 0 to 80 in increments of 10.
* **Legend (center-right):**
* `relative-Llama-8B`: Green
* `absolute-Llama-8B`: Yellow
* `relative-Gemma-2B`: Dark Red
* `absolute-Gemma-2B`: Light Blue
### Detailed Analysis or ### Content Details
**Subplot (a): Ablation Studies**
* **Llama-8B:**
* `w/o all`: ~79
* `w/o ret`: ~81
* `w/o know`: ~81
* `w/ full know`: ~82
* `ours`: ~84
* **Gemma-2B:**
* `w/o all`: ~72
* `w/o ret`: ~76
* `w/o know`: ~76
* `w/ full know`: ~75
* `ours`: ~80
**Subplot (b): Generalization**
* **Reflexion (Light Green):** Forms a triangle that extends to approximately 13 on the "Cool" axis, 6 on the "Heat" axis, and 13 on the "PutTwo" axis.
* **ETO (Light Yellow):** Forms a triangle that extends to approximately 2 on the "Cool" axis, 6 on the "Heat" axis, and 2 on the "PutTwo" axis.
**Subplot (c): Scaling Law**
* **relative-Llama-8B (Green):** Starts at approximately 79 and remains relatively stable, ending at approximately 82.
* **absolute-Llama-8B (Yellow):** Starts at approximately 42, increases sharply to approximately 68 at 20%, and then gradually increases to approximately 82 at 100%.
* **relative-Gemma-2B (Dark Red):** Starts at approximately 72 and gradually increases to approximately 79 at 100%.
* **absolute-Gemma-2B (Light Blue):** Starts at approximately 3, increases sharply to approximately 66 at 20%, and then gradually increases to approximately 80 at 100%.
### Key Observations
* **Ablation Studies:** The "ours" configuration consistently achieves the highest average reward for both Llama-8B and Gemma-2B.
* **Generalization:** Reflexion demonstrates higher values across all three axes ("Cool", "Heat", "PutTwo") compared to ETO.
* **Scaling Law:** The absolute models (absolute-Llama-8B and absolute-Gemma-2B) show a significant initial increase in average reward with increasing percentage, while the relative models (relative-Llama-8B and relative-Gemma-2B) exhibit more stable performance.
### Interpretation
The composite figure provides a comprehensive evaluation of model performance across different dimensions. The ablation studies highlight the importance of the "ours" configuration, suggesting that it incorporates key components or strategies that enhance reward. The generalization radar chart indicates that Reflexion generalizes better than ETO across the "Cool", "Heat", and "PutTwo" axes. Finally, the scaling law plot reveals that absolute models benefit more from increased scaling (percentage) in terms of average reward, particularly in the initial stages. The relative models, on the other hand, maintain a more consistent level of performance regardless of the scaling percentage.