\n
## Bar Chart, Polar Chart, and Line Graph: Model Performance Analysis
### Overview
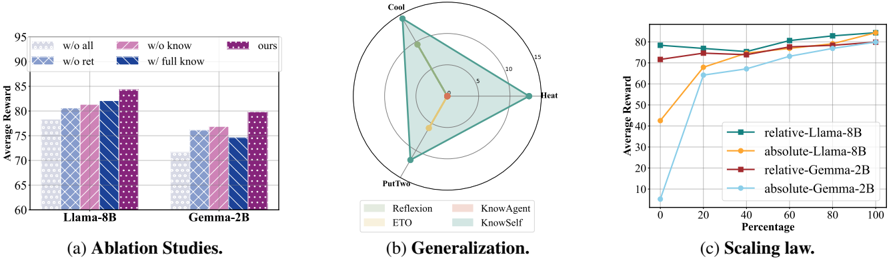
The image presents three distinct visualizations: (a) a bar chart comparing model performance under different ablation conditions, (b) a polar chart illustrating generalization capabilities, and (c) a line graph depicting scaling laws. All three charts appear to be evaluating the performance of language models, specifically Llama-8B and Gemma-2B, under various configurations and conditions.
### Components/Axes
**(a) Ablation Studies:**
* **X-axis:** Model - Llama-8B and Gemma-2B.
* **Y-axis:** Average Reward (ranging from approximately 60 to 95).
* **Bars:** Represent different ablation conditions:
* "w/o all" (light blue)
* "w/o know" (light purple)
* "w/o ret" (light orange)
* "w/ full know" (dark purple)
* "ours" (dark blue)
**(b) Generalization:**
* **Polar Plot:** Radial axes representing values from 0 to 15.
* **Angles:** Represent different generalization aspects: Reflection, KnowAgent, KnowSelf, and ETO.
* **Legend:**
* Reflection (light blue)
* ETO (light grey)
* KnowAgent (light green)
* KnowSelf (light purple)
**(c) Scaling Law:**
* **X-axis:** Scaling (ranging from 0 to 100).
* **Y-axis:** Average Reward (ranging from 0 to 80).
* **Lines:** Represent different model configurations:
* "relative-Llama-8B" (dark blue)
* "absolute-Llama-8B" (orange)
* "relative-Gemma-2B" (dark green)
* "absolute-Gemma-2B" (red)
### Detailed Analysis or Content Details
**(a) Ablation Studies:**
* **Llama-8B:**
* "w/o all": Approximately 72.
* "w/o know": Approximately 78.
* "w/o ret": Approximately 82.
* "w/ full know": Approximately 86.
* "ours": Approximately 88.
* **Gemma-2B:**
* "w/o all": Approximately 70.
* "w/o know": Approximately 74.
* "w/o ret": Approximately 77.
* "w/ full know": Approximately 79.
* "ours": Approximately 81.
**(b) Generalization:**
The polar chart shows the generalization performance across different aspects. The values are approximate due to the chart's visual nature.
* Reflection: Approximately 12.
* KnowAgent: Approximately 14.
* KnowSelf: Approximately 8.
* ETO: Approximately 5.
**(c) Scaling Law:**
* **relative-Llama-8B:** Starts at approximately 60 at scaling 0, increases to approximately 78 at scaling 20, and plateaus around 80 from scaling 40 onwards.
* **absolute-Llama-8B:** Starts at approximately 40 at scaling 0, increases rapidly to approximately 78 at scaling 20, and plateaus around 80 from scaling 40 onwards.
* **relative-Gemma-2B:** Starts at approximately 60 at scaling 0, increases to approximately 75 at scaling 20, and plateaus around 78 from scaling 40 onwards.
* **absolute-Gemma-2B:** Starts at approximately 10 at scaling 0, increases rapidly to approximately 75 at scaling 20, and plateaus around 78 from scaling 40 onwards.
### Key Observations
* In the ablation study, removing "all" components results in the lowest average reward for both models. Adding "full know" and "ours" consistently improves performance.
* The polar chart suggests that "KnowAgent" exhibits the highest generalization capability, followed by "Reflection". "ETO" shows the lowest generalization.
* The scaling law demonstrates that both models exhibit diminishing returns as scaling increases beyond 20. "Absolute" configurations start with lower rewards but catch up to "relative" configurations as scaling increases.
### Interpretation
The data suggests that the "ours" configuration, which likely represents the full model with all components, performs best across both ablation studies. The ablation studies highlight the importance of knowledge integration ("know" and "full know") and retrieval ("ret") for optimal performance.
The generalization chart indicates that the models are better at understanding and applying knowledge related to agents ("KnowAgent") and reflection, but struggle with "ETO" (likely representing a specific generalization task).
The scaling law reveals that increasing the model's scale (presumably parameters or training data) initially leads to significant performance gains, but these gains diminish as the model scales further. The difference between "relative" and "absolute" configurations suggests that the way the model is trained or evaluated (relative vs. absolute reward) impacts its scaling behavior. The initial lower performance of "absolute" configurations could be due to a more challenging evaluation setup.
Overall, the data provides insights into the model's architecture, generalization capabilities, and scaling properties, which can inform future model development and optimization efforts.