TECHNICAL ASSET FINGERPRINT
a81e59cfe07c62430f574928
Click to view fullscreen
Press ESC or click to close
FOUND IN PAPERS
EXPERT: healer-alpha-free VERSION 1
RUNTIME: free/openrouter/healer-alpha
INTEL_VERIFIED
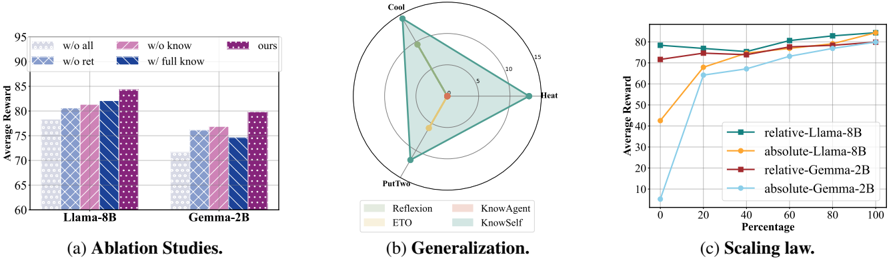
## [Multi-Panel Figure]: Ablation Studies, Generalization, and Scaling Law Analysis
### Overview
The image is a composite figure containing three distinct charts, labeled (a), (b), and (c). It presents a technical analysis comparing different methods or models, likely in the field of machine learning or reinforcement learning. The charts evaluate performance through an "Average Reward" metric across different conditions.
### Components/Axes
The figure is divided into three panels arranged horizontally:
* **Panel (a) - Left:** A grouped bar chart titled "Ablation Studies."
* **Panel (b) - Center:** A radar (spider) chart titled "Generalization."
* **Panel (c) - Right:** A line chart titled "Scaling law."
**Common Elements:**
* **Primary Metric:** "Average Reward" is the y-axis label for panels (a) and (c).
* **Models Compared:** Two base models are referenced: "Llama-8B" and "Gemma-2B."
### Detailed Analysis
#### **Panel (a): Ablation Studies**
* **Chart Type:** Grouped bar chart.
* **X-Axis:** Two categories representing base models: "Llama-8B" (left group) and "Gemma-2B" (right group).
* **Y-Axis:** "Average Reward," with a scale from 60 to 95, marked in increments of 5.
* **Legend:** Located at the top of the panel. It defines five conditions, each with a unique color/pattern:
1. `w/o all` (Light gray, diagonal hash pattern)
2. `w/o ret` (Light blue, cross-hatch pattern)
3. `w/o know` (Pink, diagonal hash pattern)
4. `w/ full know` (Dark blue, cross-hatch pattern)
5. `ours` (Purple, dotted pattern)
* **Data Points (Approximate Values):**
* **For Llama-8B:**
* `w/o all`: ~78
* `w/o ret`: ~81
* `w/o know`: ~81
* `w/ full know`: ~82
* `ours`: ~84
* **For Gemma-2B:**
* `w/o all`: ~71
* `w/o ret`: ~76
* `w/o know`: ~77
* `w/ full know`: ~75
* `ours`: ~80
#### **Panel (b): Generalization**
* **Chart Type:** Radar chart.
* **Axes:** Four radial axes emanating from the center, labeled at their outer points:
1. **Top:** "Cool"
2. **Right:** "Heat"
3. **Bottom:** "PutTwo"
4. **Left:** (Unlabeled axis, but the polygon vertices suggest it corresponds to a fourth task or condition).
* **Scale:** Concentric circles represent values from 0 (center) to 15 (outermost circle), with intermediate rings at 5 and 10.
* **Legend:** Located below the chart. It defines four methods with colored polygons:
1. `Reflexion` (Light green polygon)
2. `ETO` (Yellow polygon)
3. `KnowAgent` (Light red/pink polygon)
4. `KnowSelf` (Light blue polygon)
* **Spatial Analysis & Data Points (Approximate Values):**
* **`KnowSelf` (Light Blue):** Forms the largest, outermost polygon. Vertices are at ~15 on "Cool," ~15 on "Heat," ~12 on "PutTwo," and ~13 on the unlabeled left axis. This indicates strong, balanced performance across all tasks.
* **`KnowAgent` (Light Red):** A smaller polygon nested inside `KnowSelf`. Vertices are at ~5 on "Cool," ~10 on "Heat," ~8 on "PutTwo," and ~7 on the left axis.
* **`Reflexion` (Light Green):** A very small polygon near the center. Vertices are at ~2 on "Cool," ~3 on "Heat," ~1 on "PutTwo," and ~2 on the left axis.
* **`ETO` (Yellow):** The smallest polygon, almost a point at the center, indicating very low performance on all axes (values near 0-1).
#### **Panel (c): Scaling law**
* **Chart Type:** Line chart.
* **X-Axis:** "Percentage," with a scale from 0 to 100 in increments of 20.
* **Y-Axis:** "Average Reward," with a scale from 0 to 80 in increments of 10.
* **Legend:** Located in the bottom-right quadrant of the chart area. It defines four lines:
1. `relative-Llama-8B` (Teal line, circle markers)
2. `absolute-Llama-8B` (Orange line, diamond markers)
3. `relative-Gemma-2B` (Red line, square markers)
4. `absolute-Gemma-2B` (Light blue line, circle markers)
* **Trend Verification & Key Data Points:**
* **`relative-Llama-8B` (Teal):** Starts high (~78 at 0%), shows a slight dip at 20% (~76), then a steady, shallow upward trend to ~82 at 100%. **Trend:** High initial performance with stable, slight improvement.
* **`absolute-Llama-8B` (Orange):** Starts low (~42 at 0%), shows a very steep increase to ~68 at 20%, then continues a strong upward trend, converging with the teal line at ~82 by 100%. **Trend:** Dramatic improvement from low starting point.
* **`relative-Gemma-2B` (Red):** Starts moderately high (~72 at 0%), shows a steady, shallow upward trend to ~80 at 100%. **Trend:** Consistent, moderate improvement.
* **`absolute-Gemma-2B` (Light Blue):** Starts very low (~8 at 0%), shows a steep initial increase to ~65 at 20%, then continues a strong upward trend, reaching ~80 at 100%. **Trend:** Most dramatic relative improvement, starting from near zero.
### Key Observations
1. **Ablation Study (a):** The proposed method (`ours`) consistently achieves the highest Average Reward for both Llama-8B and Gemma-2B models. Removing components (`w/o all`, `w/o ret`, `w/o know`) generally degrades performance, with `w/o all` being the worst. Interestingly, for Gemma-2B, `w/ full know` performs slightly worse than `w/o know` and `w/o ret`.
2. **Generalization (b):** There is a clear performance hierarchy: `KnowSelf` >> `KnowAgent` > `Reflexion` > `ETO`. `KnowSelf` demonstrates superior and balanced generalization across the four evaluated tasks ("Cool", "Heat", "PutTwo", and the unlabeled axis).
3. **Scaling Law (c):** All methods show improved Average Reward as the "Percentage" (likely training data or compute) increases. The "absolute" variants (orange, light blue) start from much lower rewards but exhibit steeper learning curves, eventually converging with their "relative" counterparts (teal, red) at 100%. The Llama-8B models generally outperform the Gemma-2B models at lower percentages.
### Interpretation
This figure collectively argues for the effectiveness of a proposed method (likely `KnowSelf` or `ours`).
* **Panel (a)** justifies the method's design by showing that each component contributes to its superior performance over ablated versions.
* **Panel (b)** demonstrates the method's (`KnowSelf`) robust generalization capability across diverse tasks, significantly outperforming baseline methods like `Reflexion` and `ETO`.
* **Panel (c)** provides a scaling analysis, showing that while all methods benefit from more resources, the proposed approach (likely represented by the "relative" lines) maintains a performance advantage, especially in low-resource (low percentage) regimes. The convergence at 100% suggests that with sufficient data/compute, simpler "absolute" methods may catch up, but the proposed method is more efficient.
**Notable Anomaly:** In panel (a) for Gemma-2B, the `w/ full know` condition underperforms compared to `w/o know` and `w/o ret`. This could indicate a potential negative interaction or overfitting when that specific component is fully enabled for the smaller Gemma model, which does not occur with the larger Llama-8B. This warrants further investigation.
DECODING INTELLIGENCE...