## Chart/Diagram Type: Multi-part Technical Analysis Visualization
### Overview
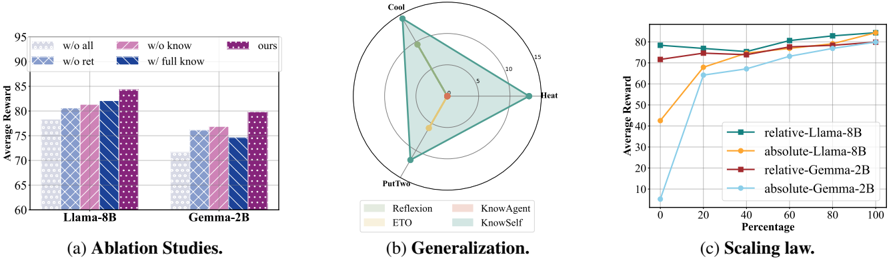
The image contains three distinct visualizations:
1. **(a) Ablation Studies**: Bar chart comparing model performance under different configurations.
2. **(b) Generalization**: Radar chart evaluating multi-dimensional performance metrics.
3. **(c) Scaling law**: Line graph showing performance trends across data percentages.
### Components/Axes
#### (a) Ablation Studies
- **X-axis**: Model variants (`LLaMA-8B`, `Gemma-2B`).
- **Y-axis**: `Average Reward` (60–95).
- **Legend**:
- `w/o all` (gray crosshatch)
- `w/o know` (pink diagonal)
- `w/o ret` (blue diagonal)
- `w/ full know` (blue solid)
- `ours` (purple dotted).
#### (b) Generalization
- **Axes**: Three radial metrics labeled `Cool`, `Heat`, `PutTwo`.
- **Legend**:
- `Reflexion` (light green)
- `KnowAgent` (pink)
- `ETO` (yellow)
- `KnowSelf` (blue).
- **Center**: Red dot labeled `0`.
#### (c) Scaling law
- **X-axis**: `Percentage` (0–100).
- **Y-axis**: `Average Reward` (10–80).
- **Legend**:
- `relative-LLaMA-8B` (green)
- `absolute-LLaMA-8B` (orange)
- `relative-Gemma-2B` (red)
- `absolute-Gemma-2B` (blue).
### Detailed Analysis
#### (a) Ablation Studies
- **LLaMA-8B**:
- `w/o all`: ~78
- `w/o know`: ~81
- `w/o ret`: ~82
- `w/ full know`: ~83
- `ours`: ~84
- **Gemma-2B**:
- `w/o all`: ~72
- `w/o know`: ~76
- `w/o ret`: ~74
- `w/ full know`: ~75
- `ours`: ~79
#### (b) Generalization
- **Reflexion**: Dominates `Cool` and `PutTwo` axes (~12–15 range).
- **KnowAgent**: Strongest in `Heat` (~15 range).
- **ETO**: Weakest overall (~5–8 range).
- **KnowSelf**: Balanced performance (~10–12 range).
#### (c) Scaling law
- **absolute-LLaMA-8B**: Starts at ~40, rises sharply to ~80 by 100%.
- **relative-LLaMA-8B**: Starts at ~70, plateaus near ~80.
- **absolute-Gemma-2B**: Starts at ~10, climbs to ~80 by 100%.
- **relative-Gemma-2B**: Starts at ~70, plateaus near ~80.
### Key Observations
1. **Ablation Studies**:
- `ours` (purple dotted) consistently outperforms all variants for both models.
- Removing `know` or `ret` components reduces performance.
2. **Generalization**:
- `Reflexion` excels in `Cool`/`PutTwo` but lags in `Heat`.
- `KnowAgent` specializes in `Heat` but underperforms elsewhere.
3. **Scaling law**:
- `absolute` models (orange/blue) show steeper improvement with data percentage.
- `relative` models (green/red) plateau earlier.
### Interpretation
1. **Ablation Insights**:
- The `ours` configuration (purple dotted) integrates all components optimally, suggesting synergistic effects.
- Removing `know` (pink) or `ret` (blue) degrades performance, highlighting their critical roles.
2. **Generalization Trade-offs**:
- Models specialize in specific metrics (`Cool`, `Heat`, `PutTwo`), indicating limited cross-domain adaptability.
- `ETO` (yellow) underperforms across all axes, suggesting architectural limitations.
3. **Scaling Dynamics**:
- `absolute` models (orange/blue) benefit more from increased data, while `relative` models (green/red) rely on parameter efficiency.
- Gemma-2B’s `absolute` variant (blue) matches LLaMA-8B’s performance despite smaller size, implying architectural efficiency.
**Critical Note**: The radar chart’s axes (`Cool`, `Heat`, `PutTwo`) lack explicit definitions, limiting interpretability. The bar chart’s error bars (if present) are not visible, so uncertainty estimates are approximate.