## Line Graphs: Residual Analysis (2018-2023)
### Overview
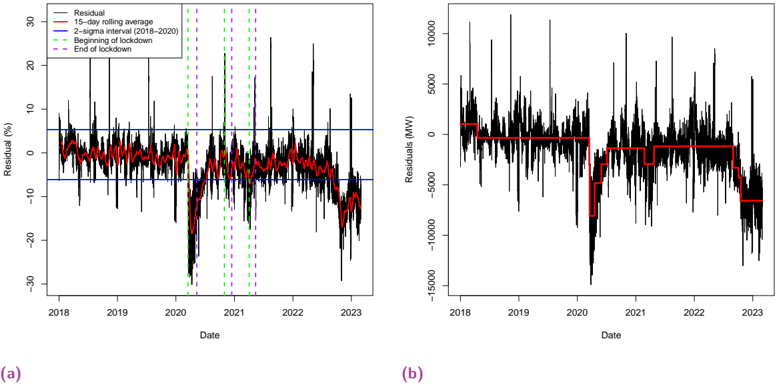
Two line graphs (a) and (b) depict residual values over time, with chart (a) showing percentage residuals and chart (b) showing megawatt (MW) residuals. Both include a 15-day rolling average (red line) and vertical markers for key events: 2-sigma interval (2018-2020), beginning of lockdown (green dashed), and end of lockdown (purple dashed).
---
### Components/Axes
#### Chart (a)
- **X-axis**: Date (2018–2023)
- **Y-axis**: Residual (%) (-30% to 30%)
- **Legend**:
- Red: 15-day rolling average
- Blue: 2-sigma interval (2018–2020)
- Green dashed: Beginning of lockdown
- Purple dashed: End of lockdown
- **Vertical Markers**:
- Green dashed line: ~March 2020 (lockdown start)
- Purple dashed line: ~June 2020 (lockdown end)
- Blue dashed lines: 2-sigma interval boundaries (2018–2020)
#### Chart (b)
- **X-axis**: Date (2018–2023)
- **Y-axis**: Residual (MW) (-15,000 to 15,000)
- **Legend**:
- Red: 15-day rolling average
- **Vertical Markers**:
- Same as chart (a): Green (lockdown start), Purple (lockdown end), Blue (2-sigma interval)
---
### Detailed Analysis
#### Chart (a)
- **Trend**: Residuals fluctuate around 0% with spikes up to ~20% and dips to ~-20%.
- **Key Events**:
- **Lockdown Period (March–June 2020)**: Residuals drop sharply to ~-15% (below the 15-day average).
- **2-sigma Interval (2018–2020)**: Residuals exceed ±10% more frequently outside this period.
- **Notable Outliers**:
- A spike to ~25% in late 2019.
- A dip to ~-25% in early 2021.
#### Chart (b)
- **Trend**: Residuals oscillate between ~-10,000 MW and ~10,000 MW, with the 15-day average (red line) showing a stepwise decline during the lockdown.
- **Key Events**:
- **Lockdown Period**: Residuals plummet to ~-10,000 MW (red line dips sharply).
- **Post-Lockdown**: Residuals rebound but remain below pre-2020 levels.
- **Notable Outliers**:
- A spike to ~12,000 MW in mid-2019.
- A drop to ~-12,000 MW in late 2022.
---
### Key Observations
1. **Lockdown Impact**: Both charts show a significant drop in residuals during the lockdown period (March–June 2020), with chart (b) reflecting a larger magnitude (-10,000 MW vs. -15%).
2. **Volatility**: Residuals exhibit higher variability outside the 2-sigma interval (2018–2020), particularly in 2021–2023.
3. **Recovery**: Post-lockdown residuals in chart (a) partially recover but remain below pre-2020 baselines. Chart (b) shows a more prolonged deficit.
---
### Interpretation
- **Systemic Disruption**: The lockdown correlates with a sharp decline in residuals, suggesting reduced activity or demand (e.g., energy consumption, industrial output).
- **2-sigma Interval**: The 2018–2020 period may represent a "normal" operational range, with post-2020 residuals indicating systemic changes (e.g., remote work, supply chain shifts).
- **Divergence in Metrics**: Chart (a) highlights percentage-based anomalies, while chart (b) quantifies absolute magnitude, revealing scale-dependent impacts (e.g., a 15% drop in (a) translates to ~-10,000 MW in (b)).
- **Long-Term Effects**: Persistent residuals post-lockdown suggest lasting structural changes, possibly due to economic or behavioral shifts.
---
### Spatial Grounding & Verification
- **Legend Placement**: Top-left corner in both charts, ensuring clarity.
- **Color Consistency**: Red lines (15-day average) match across both charts. Vertical markers align with legend labels.
- **Trend Verification**:
- Chart (a): Red line slopes downward during lockdown, confirming the dip.
- Chart (b): Red line shows a stepwise decline, aligning with residual drops.
---
### Content Details
- **Chart (a) Values**:
- Pre-lockdown: Residuals range from ~-5% to ~15%.
- Lockdown: Residuals drop to ~-15%.
- Post-lockdown: Residuals recover to ~-5% but remain below 2019 levels.
- **Chart (b) Values**:
- Pre-lockdown: Residuals range from ~-5,000 MW to ~10,000 MW.
- Lockdown: Residuals drop to ~-10,000 MW.
- Post-lockdown: Residuals rebound to ~-2,000 MW but remain below 2019 baselines.
---
### Final Notes
The data underscores the lockdown's profound impact on the measured system, with residuals reflecting both immediate and prolonged disruptions. The 2-sigma interval and 15-day rolling average provide context for normal variability versus anomalous events.