## Scatter Plot Matrix: Token Embeddings in PCA Space
### Overview
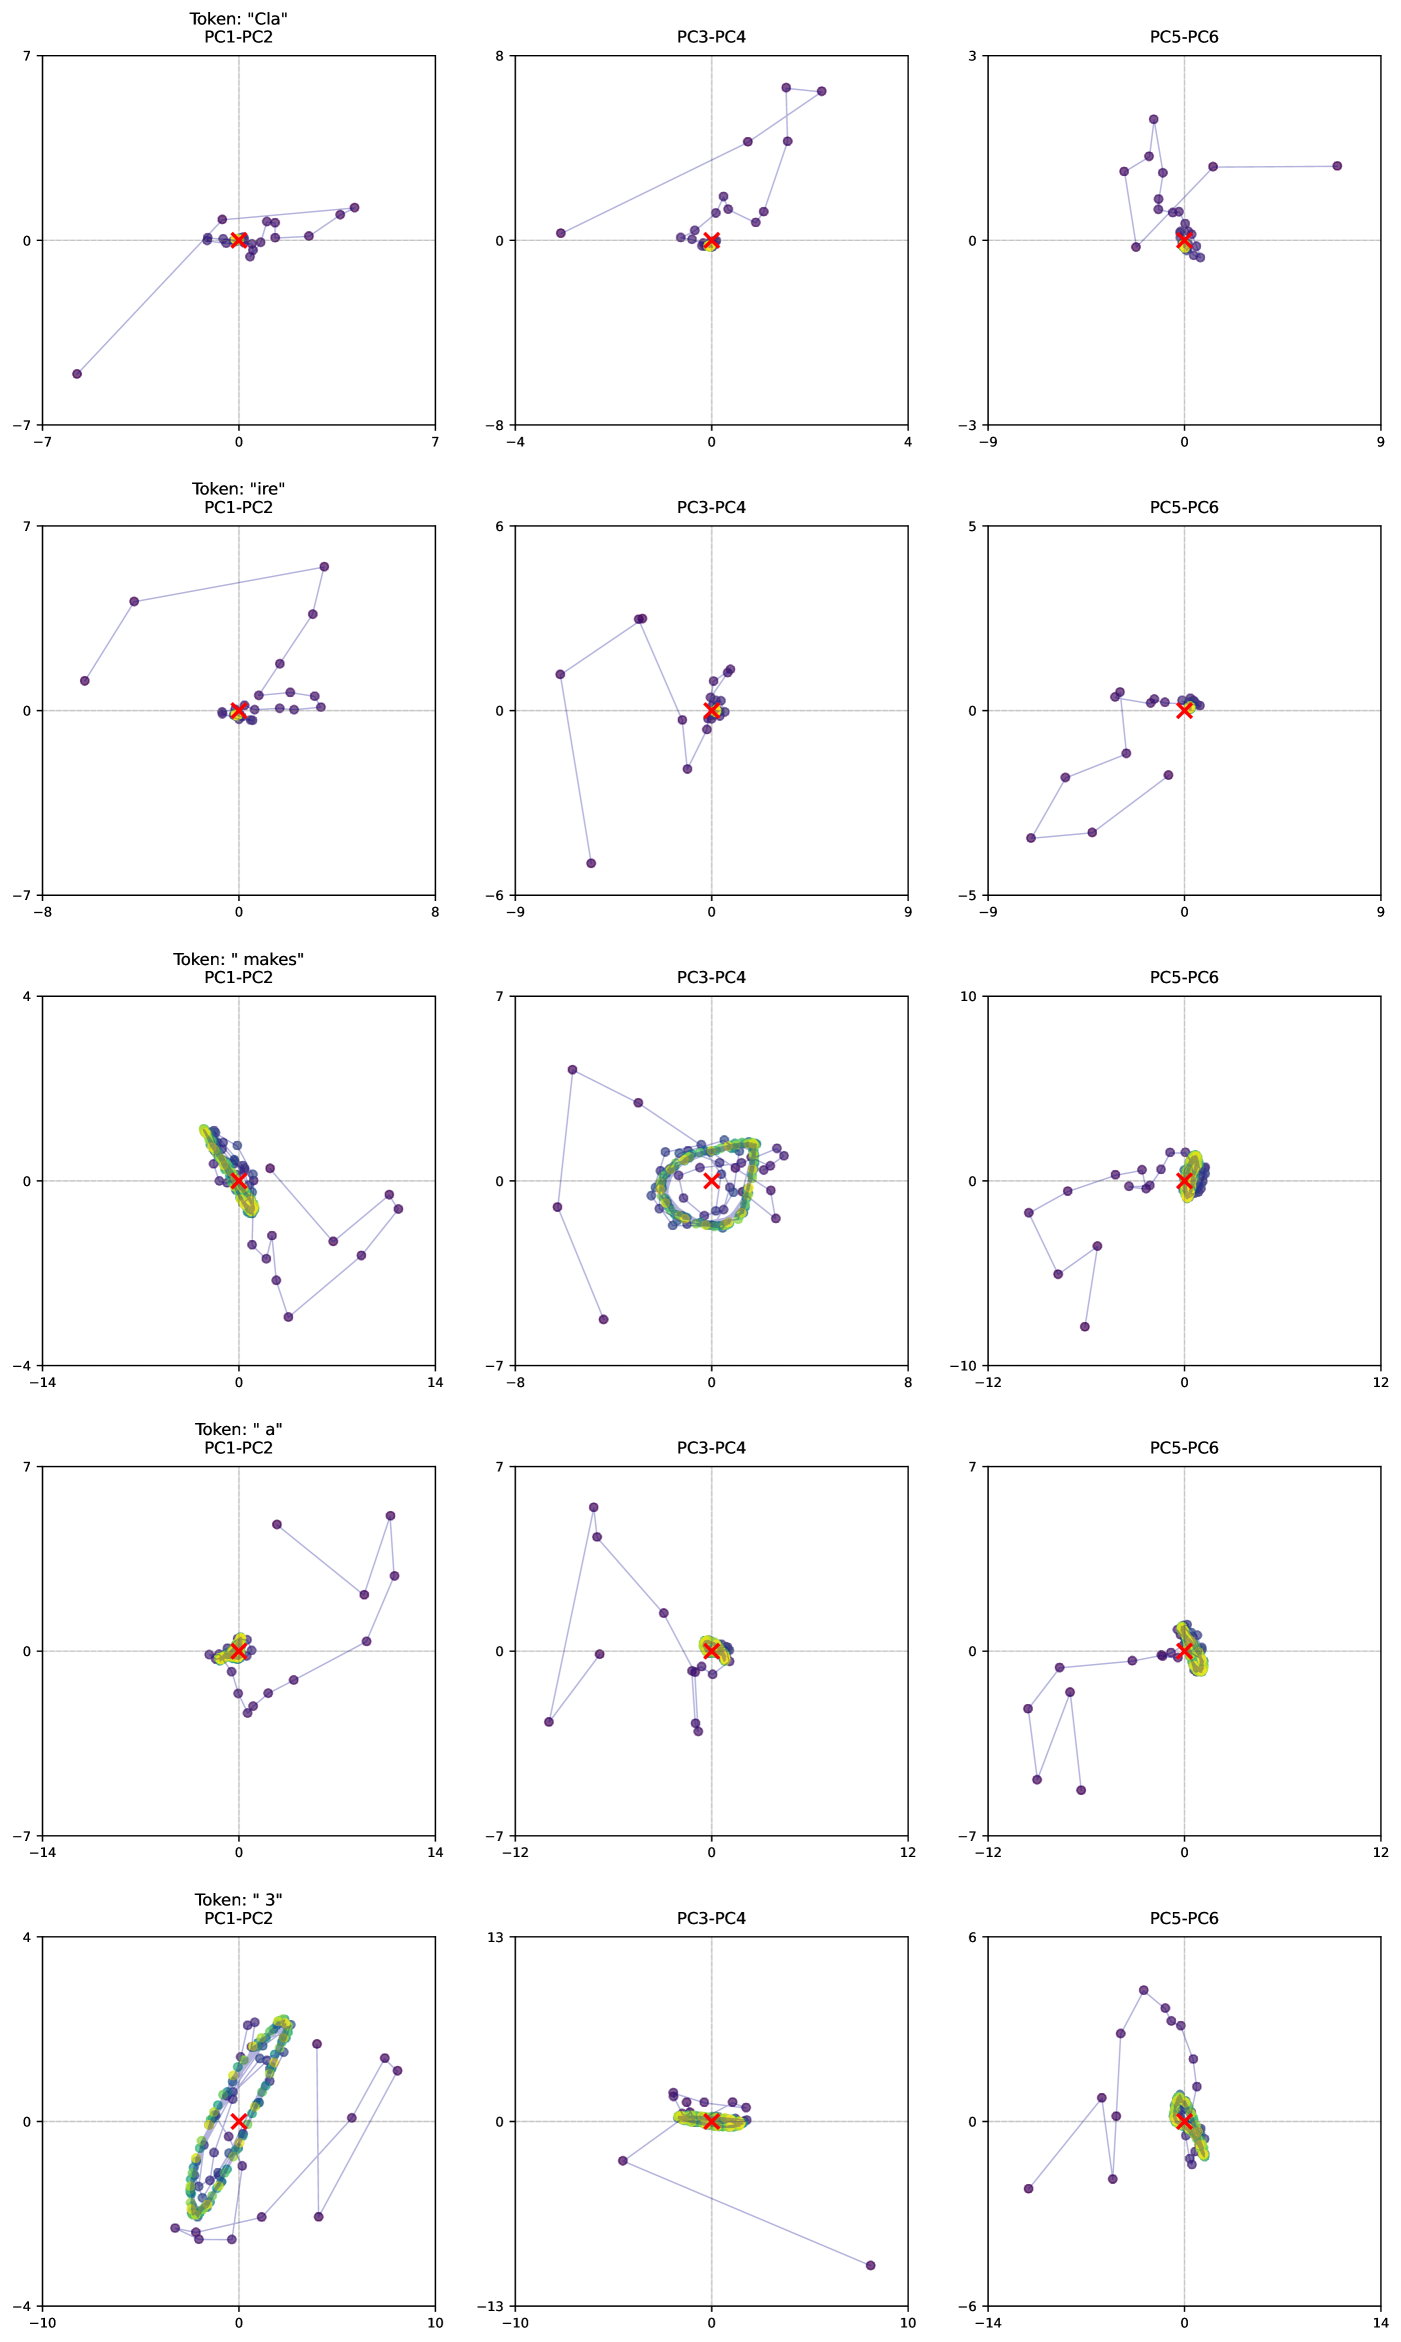
The image presents a 3x5 grid of scatter plots, visualizing the embeddings of different tokens ("Cla", "ire", " makes", " a", " 3") in a reduced-dimensional space defined by Principal Component Analysis (PCA). Each row corresponds to a specific token, and each column represents a different pair of principal components (PC1-PC2, PC3-PC4, PC5-PC6). The plots show the trajectory of the token embedding over time, with each point representing the embedding at a particular time step. A red 'X' marks the final embedding position. The density of points is indicated by a green-yellow-blue color gradient.
### Components/Axes
Each scatter plot has the following components:
* **Title:** Indicates the token and the principal components being plotted (e.g., "Token: 'Cla' PC1-PC2").
* **X-axis:** Represents the first principal component in the pair (e.g., PC1, PC3, PC5).
* **Y-axis:** Represents the second principal component in the pair (e.g., PC2, PC4, PC6).
* **Data Points:** Blue-purple dots connected by light blue-grey lines, showing the trajectory of the token embedding.
* **Final Embedding:** A red 'X' marks the final position of the token embedding.
* **Density Gradient:** A green-yellow-blue color gradient indicates the density of points, with blue representing lower density and yellow/green representing higher density.
* **Axis Gridlines:** Dashed grey lines mark the zero positions on both axes.
The axis ranges vary between plots. Here's a summary:
| Plot | X-axis Range | Y-axis Range |
|---------------|--------------|--------------|
| Cla PC1-PC2 | -7 to 7 | -7 to 7 |
| Cla PC3-PC4 | -4 to 4 | -8 to 8 |
| Cla PC5-PC6 | -9 to 9 | -3 to 3 |
| ire PC1-PC2 | -8 to 8 | -7 to 7 |
| ire PC3-PC4 | -4 to 4 | -6 to 6 |
| ire PC5-PC6 | -9 to 9 | -5 to 5 |
| makes PC1-PC2 | -14 to 14 | -4 to 4 |
| makes PC3-PC4 | -8 to 8 | -7 to 7 |
| makes PC5-PC6 | -12 to 12 | -10 to 10 |
| a PC1-PC2 | -14 to 14 | -7 to 7 |
| a PC3-PC4 | -8 to 8 | -7 to 7 |
| a PC5-PC6 | -12 to 12 | -7 to 7 |
| 3 PC1-PC2 | -10 to 10 | -4 to 4 |
| 3 PC3-PC4 | -13 to 13 | -13 to 13 |
| 3 PC5-PC6 | -14 to 14 | -6 to 6 |
### Detailed Analysis
Each row represents a token, and the columns show the token's trajectory in different PCA spaces.
* **Token: "Cla"**
* **PC1-PC2:** The trajectory starts at approximately (-6, -6), moves towards the center, and ends near (0, 0).
* **PC3-PC4:** The trajectory starts at approximately (-3, 7), moves towards the center, and ends near (0, 0).
* **PC5-PC6:** The trajectory starts at approximately (-7, 2), moves towards the center, and ends near (0, 0).
* **Token: "ire"**
* **PC1-PC2:** The trajectory starts at approximately (-7, 5), moves towards the center, and ends near (0, 0).
* **PC3-PC4:** The trajectory starts at approximately (-3, 5), moves towards the center, and ends near (0, 0).
* **PC5-PC6:** The trajectory starts at approximately (-7, 0), moves towards the center, and ends near (0, 0).
* **Token: " makes"**
* **PC1-PC2:** The trajectory starts at approximately (-12, -2), moves towards the center, and ends near (0, 0). There is a high density of points near the center.
* **PC3-PC4:** The trajectory starts at approximately (-7, 0), moves towards the center, and ends near (0, 0). There is a high density of points near the center.
* **PC5-PC6:** The trajectory starts at approximately (-10, 0), moves towards the center, and ends near (0, 0). There is a high density of points near the center.
* **Token: " a"**
* **PC1-PC2:** The trajectory starts at approximately (-12, 5), moves towards the center, and ends near (0, 0). There is a high density of points near the center.
* **PC3-PC4:** The trajectory starts at approximately (-7, 6), moves towards the center, and ends near (0, 0). There is a high density of points near the center.
* **PC5-PC6:** The trajectory starts at approximately (-10, 6), moves towards the center, and ends near (0, 0). There is a high density of points near the center.
* **Token: " 3"**
* **PC1-PC2:** The trajectory starts at approximately (8, 2), moves towards the center, and ends near (0, 0). There is a high density of points near the center.
* **PC3-PC4:** The trajectory starts at approximately (-10, 1), moves towards the center, and ends near (0, 0). There is a high density of points near the center.
* **PC5-PC6:** The trajectory starts at approximately (-12, 5), moves towards the center, and ends near (0, 0). There is a high density of points near the center.
### Key Observations
* **Convergence:** In most plots, the trajectories tend to converge towards the center (0, 0).
* **Density:** The tokens " makes", " a", and " 3" show a higher density of points near the center in all three PCA spaces compared to "Cla" and "ire".
* **Variance:** The range of the axes varies across different PC pairs, indicating the variance captured by each PC.
### Interpretation
The plots visualize how the embeddings of different tokens evolve over time in a reduced-dimensional PCA space. The convergence towards the center (0, 0) suggests that the token embeddings become more stable or less variable as the model processes the input. The higher density of points near the center for tokens like " makes", " a", and " 3" might indicate that these tokens have more consistent or predictable embeddings compared to "Cla" and "ire". The different axis ranges reflect the amount of variance captured by each principal component, with larger ranges indicating higher variance. Overall, these plots provide insights into the dynamics and stability of token embeddings in a neural network model.