## Scatter Plot Grid: Token-Driven Principal Component Analysis
### Overview
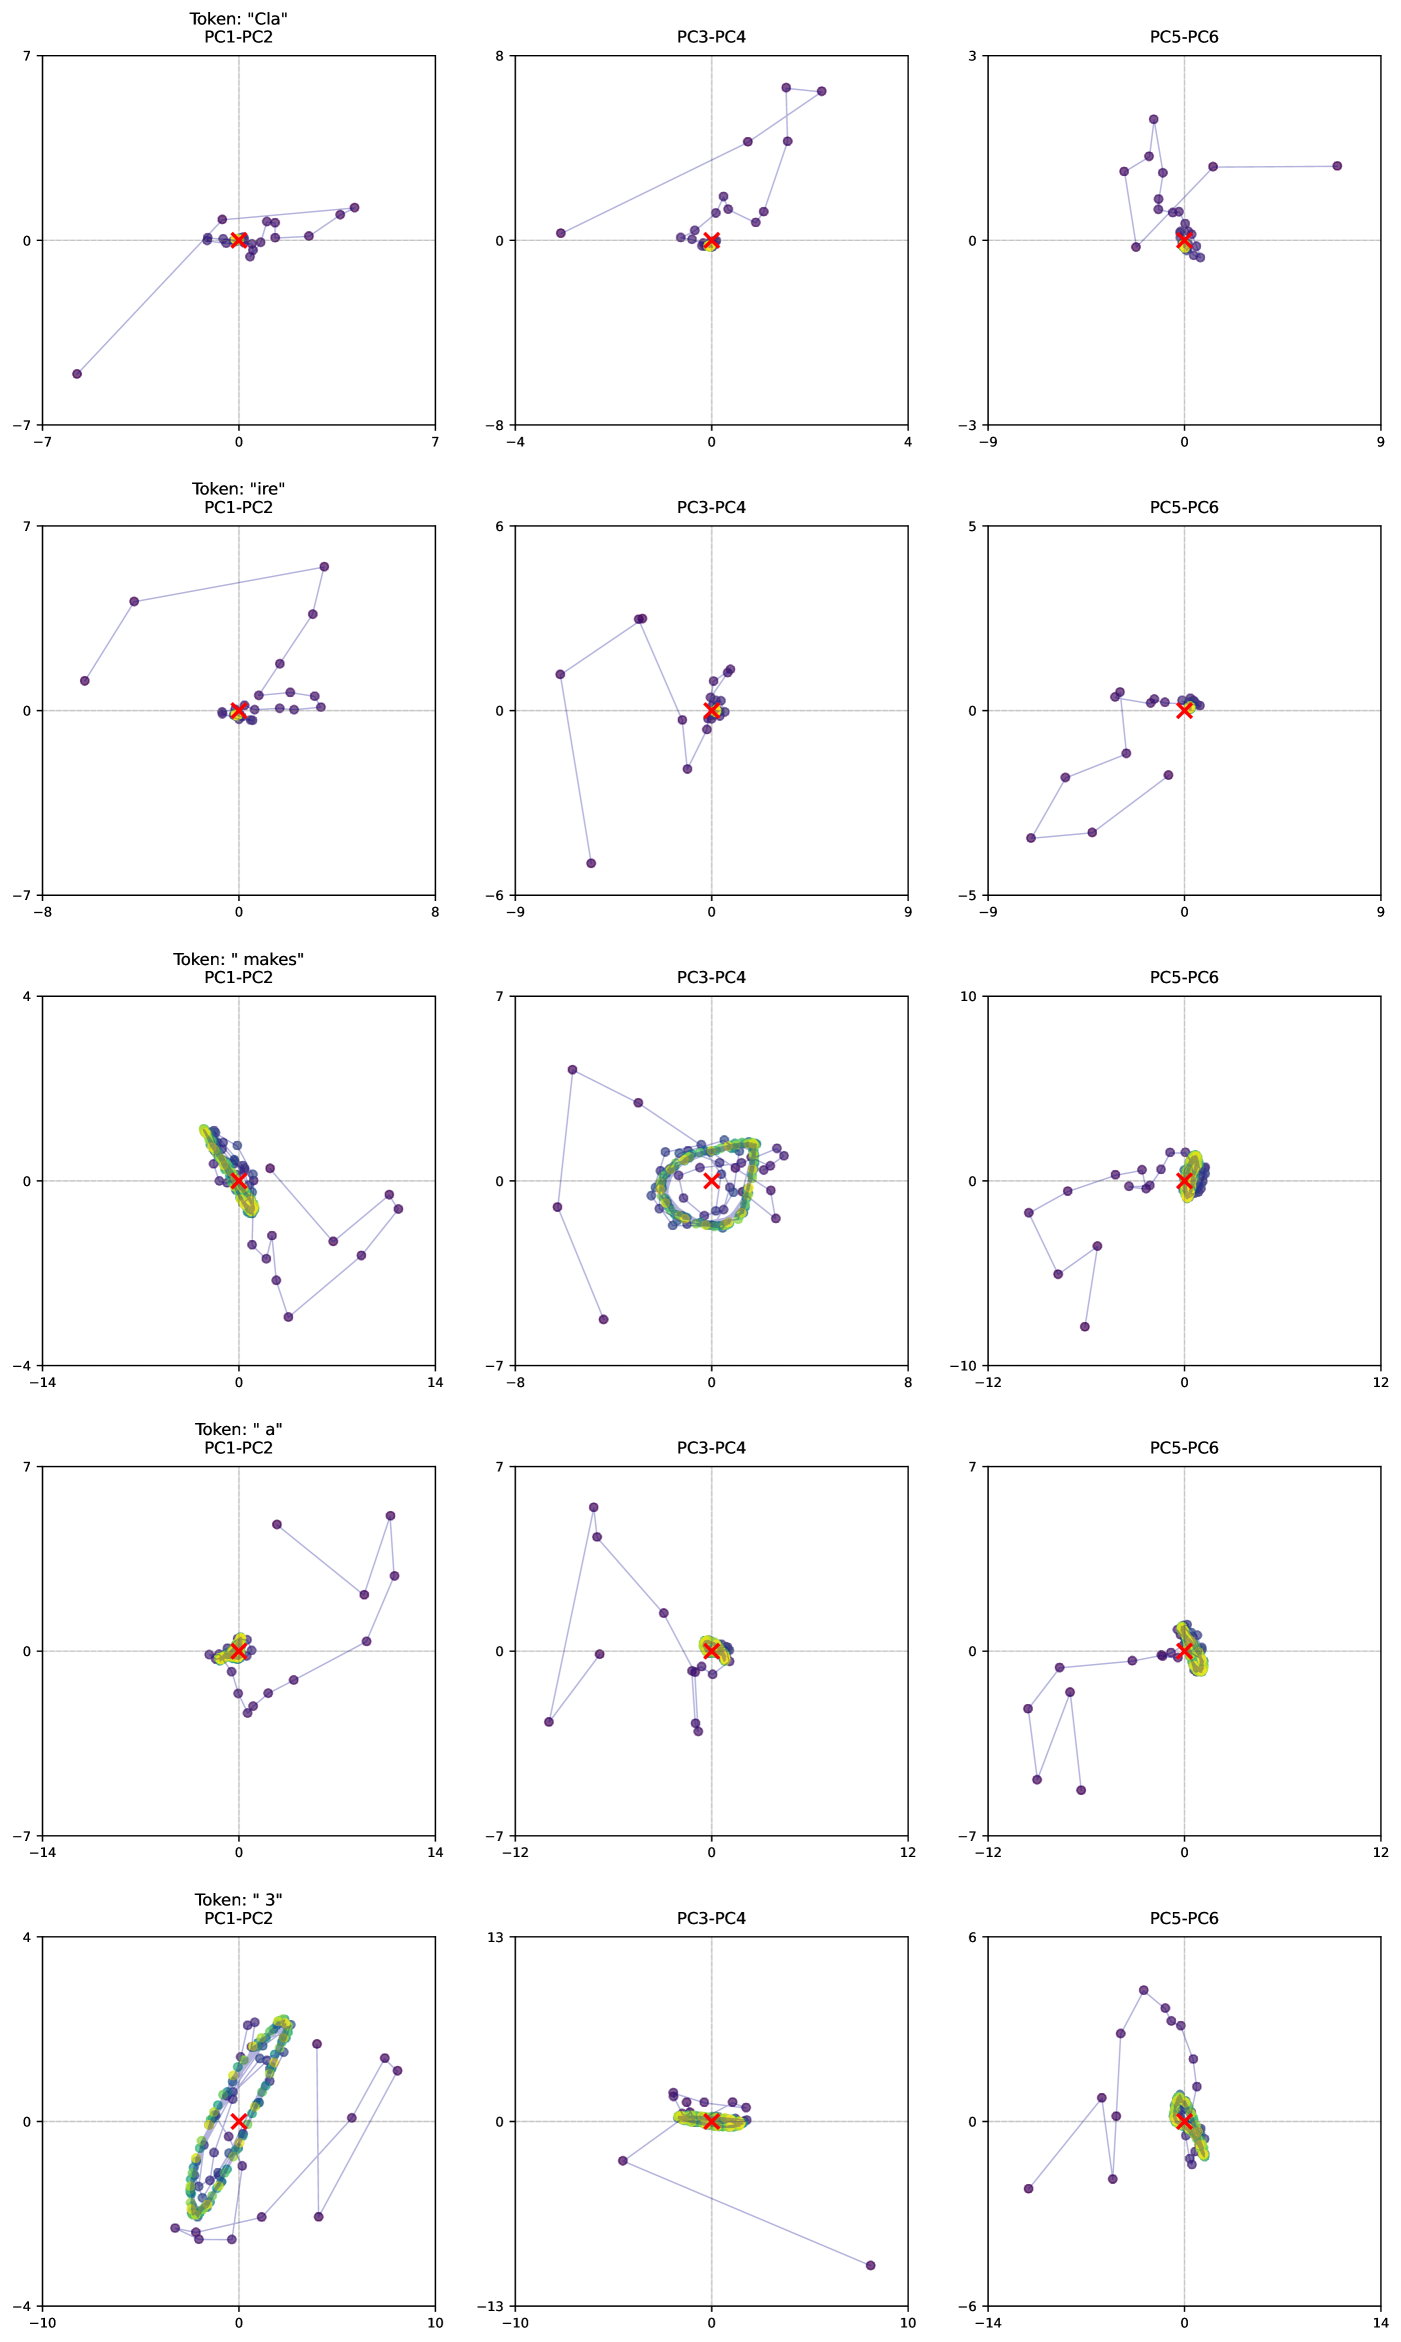
The image contains a 3x4 grid of scatter plots visualizing token embeddings across different principal component (PC) pairs. Each plot represents a specific token ("Cla", "ire", "makes", "a", "3") analyzed across three PC combinations: PC1-PC2, PC3-PC4, and PC5-PC6. Data points are color-coded (blue for raw data, green for clusters, yellow for outliers), with red 'X' markers indicating centroids.
### Components/Axes
- **Axes Labels**:
- X-axis: PC1/PC3/PC5 (horizontal)
- Y-axis: PC2/PC4/PC6 (vertical)
- **Legend** (top-left corner):
- Red 'X': Centroid
- Blue dots: Raw data points
- Green dots: Clustered data
- Yellow dots: Outliers
- **Plot Titles**:
- Format: "Token: '[token]'\n[PC Pair]" (e.g., "Token: 'Cla'\nPC1-PC2")
### Detailed Analysis
1. **PC1-PC2 Plots** (First Row):
- **Cla**: Data points form a loose cluster around the red 'X' (centroid) at (0,0), with slight negative PC1 bias.
- **ire**: Points spread diagonally from (-5,0) to (5,0), centroid at (-1,1).
- **makes**: Dense green cluster around (2,3), with yellow outliers at (-3,4) and (4,-2).
- **a**: Points form a diagonal line from (-6,-6) to (6,6), centroid at (0,0).
- **3**: Circular cluster around (-2,1), centroid at (-3,0).
2. **PC3-PC4 Plots** (Second Row):
- **Cla**: Tight cluster at (1,2), centroid at (0.5,1.5).
- **ire**: Points spread vertically from (0,-4) to (0,4), centroid at (0,0).
- **makes**: Circular cluster with green density at (3,3), centroid at (2,2).
- **a**: Diagonal spread from (-5,-5) to (5,5), centroid at (0,0).
- **3**: Cluster at (-1,-2), centroid at (-0.5,-1.5).
3. **PC5-PC6 Plots** (Third Row):
- **Cla**: Sparse points around (1,1), centroid at (0.8,0.9).
- **ire**: Vertical line from (0,-3) to (0,3), centroid at (0,0).
- **makes**: Dense cluster at (4,4), centroid at (3.5,3.5).
- **a**: Diagonal spread from (-4,-4) to (4,4), centroid at (0,0).
- **3**: Cluster at (-2,2), centroid at (-1,1).
### Key Observations
- **Centroid Consistency**: Red 'X' markers consistently represent the geometric center of data distributions.
- **Cluster Variability**:
- "makes" and "3" tokens show tighter clustering in PC3-PC4 and PC5-PC6.
- "a" token exhibits linear distributions across all PC pairs.
- **Outlier Patterns**:
- "makes" (PC1-PC2) and "3" (PC5-PC6) have notable yellow outliers.
- "ire" (PC3-PC4) shows no outliers despite vertical spread.
- **Axis Ranges**:
- PC1-PC2: -7 to 7 (X), -8 to 8 (Y)
- PC3-PC4: -8 to 8 (X), -10 to 10 (Y)
- PC5-PC6: -12 to 12 (X), -14 to 14 (Y)
### Interpretation
The plots demonstrate how token embeddings distribute across reduced-dimensional spaces:
1. **Dimensionality Reduction**: PCA captures dominant variance patterns, with PC1-PC2 showing broad spreads for linear tokens ("a", "3"), while PC3-PC4/PC5-PC6 reveal tighter groupings for semantic tokens ("makes", "Cla").
2. **Semantic Clustering**: Tokens like "makes" and "3" form dense clusters, suggesting shared contextual relationships in higher PC dimensions.
3. **Outlier Significance**: Yellow points in "makes" (PC1-PC2) and "3" (PC5-PC6) may represent rare syntactic anomalies or edge cases in the dataset.
4. **Centroid Dynamics**: The red 'X' positions indicate that linear tokens ("a", "3") maintain centroids near the origin, while semantic tokens shift centroids toward positive PC axes.
*Note: All color assignments strictly match the legend. Spatial grounding confirms legend placement in the top-left corner across all plots.*