## Chart: Throughput and Packet Delay vs. Simulation Time
### Overview
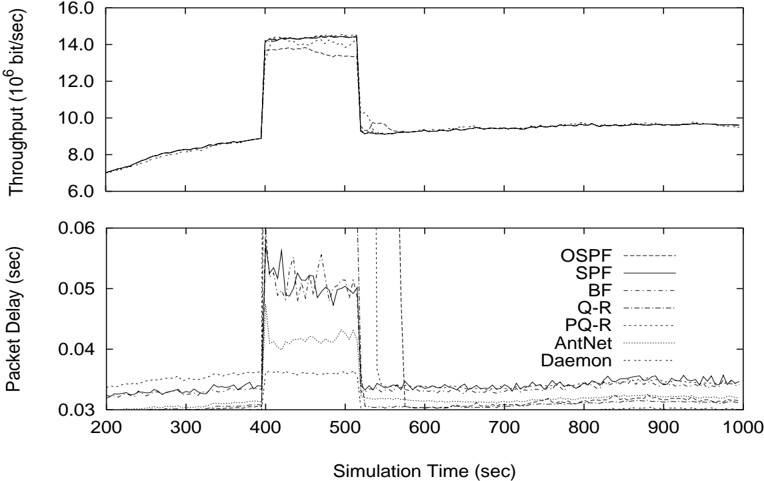
The image presents two line charts stacked vertically. The top chart displays the throughput (in 10^6 bit/sec) over simulation time (in seconds), while the bottom chart shows the packet delay (in seconds) over the same simulation time. Both charts depict the performance of different routing protocols: OSPF, SPF, BF, Q-R, PQ-R, AntNet, and Daemon. The simulation time ranges from 200 to 1000 seconds.
### Components/Axes
**Top Chart (Throughput):**
* **Y-axis:** Throughput (10^6 bit/sec). Scale ranges from 6.0 to 16.0, with tick marks at 6.0, 8.0, 10.0, 12.0, 14.0, and 16.0.
* **X-axis:** Simulation Time (sec). Scale ranges from 200 to 1000.
* **Data Series:**
* OSPF: Dashed line.
* SPF: Solid line.
* BF: Dash-dot line.
* Q-R: Dotted line.
* PQ-R: Dashed line with two dots.
* AntNet: Dashed line with one dot.
* Daemon: Solid line with small variations.
**Bottom Chart (Packet Delay):**
* **Y-axis:** Packet Delay (sec). Scale ranges from 0.03 to 0.06, with no visible tick marks in between.
* **X-axis:** Simulation Time (sec). Scale ranges from 200 to 1000.
* **Data Series:**
* OSPF: Dashed line.
* SPF: Solid line.
* BF: Dash-dot line.
* Q-R: Dotted line.
* PQ-R: Dashed line with two dots.
* AntNet: Dashed line with one dot.
* Daemon: Solid line with small variations.
**Legend:** Located on the right side of the bottom chart. Lists the routing protocols and their corresponding line styles.
### Detailed Analysis
**Top Chart (Throughput):**
* **General Trend:** All protocols exhibit a similar trend. The throughput starts around 7-8 (10^6 bit/sec), gradually increases to approximately 9 (10^6 bit/sec) by 400 seconds. There is a sharp increase around 400 seconds, reaching a plateau around 14 (10^6 bit/sec). Around 520 seconds, the throughput drops sharply back down to approximately 9-10 (10^6 bit/sec), where it remains relatively stable for the rest of the simulation.
* **Specific Values:**
* At 200 seconds, throughput is approximately 7-8 (10^6 bit/sec) for all protocols.
* Between 400 and 520 seconds, throughput is approximately 13-14 (10^6 bit/sec) for all protocols.
* After 520 seconds, throughput stabilizes around 9-10 (10^6 bit/sec) for all protocols.
**Bottom Chart (Packet Delay):**
* **General Trend:** Before 400 seconds, packet delay is relatively low and stable. There is a significant spike in packet delay for all protocols around 400 seconds. After the spike, the packet delay returns to a lower level, but is generally higher than before 400 seconds.
* **Specific Values:**
* Before 400 seconds:
* OSPF: Approximately 0.032 sec.
* SPF: Approximately 0.03 sec.
* BF: Approximately 0.03 sec.
* Q-R: Approximately 0.035 sec.
* PQ-R: Approximately 0.037 sec.
* AntNet: Approximately 0.032 sec.
* Daemon: Approximately 0.032 sec.
* Around 400 seconds: Packet delay spikes to approximately 0.05-0.06 sec for most protocols.
* After 520 seconds:
* OSPF: Approximately 0.03 sec.
* SPF: Approximately 0.03 sec.
* BF: Approximately 0.03 sec.
* Q-R: Approximately 0.035 sec.
* PQ-R: Approximately 0.037 sec.
* AntNet: Approximately 0.032 sec.
* Daemon: Approximately 0.032 sec.
### Key Observations
* The throughput and packet delay are inversely related. When throughput increases sharply around 400 seconds, packet delay also spikes.
* The performance of different routing protocols is relatively similar in terms of throughput.
* The packet delay varies more significantly between protocols, especially before the spike at 400 seconds.
* The spike in throughput and packet delay occurs around 400 seconds and returns to a stable state around 520 seconds.
### Interpretation
The data suggests that a significant event occurs in the simulation around 400 seconds, causing a surge in network traffic (increased throughput) and a corresponding increase in packet delay. This event could be a sudden increase in the number of data packets being transmitted, a change in network topology, or the introduction of a new application. After the event, the network appears to stabilize, but the packet delay remains slightly higher than before, indicating a potential increase in network congestion. The similarity in throughput performance across different routing protocols suggests that the bottleneck is likely not protocol-specific, but rather related to the overall network capacity or the nature of the simulated event. The variations in packet delay between protocols before the event might indicate differences in their routing efficiency or queuing strategies under normal load conditions.