\n
## Line Chart: Network Performance Metrics
### Overview
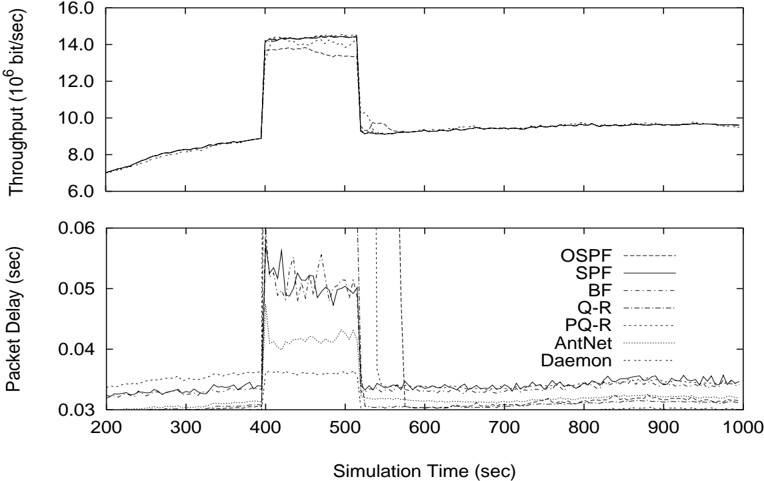
The image presents two line charts displaying network performance metrics over simulation time. The top chart shows throughput, while the bottom chart shows packet delay. Both charts share the same x-axis representing simulation time in seconds, ranging from 200 to 1000. The bottom chart includes a legend identifying different routing protocols.
### Components/Axes
* **Top Chart:**
* Y-axis: Throughput (10<sup>6</sup> bit/sec), ranging from 6.0 to 16.0.
* X-axis: Simulation Time (sec), ranging from 200 to 1000.
* **Bottom Chart:**
* Y-axis: Packet Delay (sec), ranging from 0.03 to 0.06.
* X-axis: Simulation Time (sec), ranging from 200 to 1000.
* Legend (top-right):
* OSPF (solid line)
* SPF (dashed line)
* BF (dotted line)
* Q-R (dash-dot line)
* PQ-R (long dash-dot line)
* AntNet (dashed line)
* Daemon (dotted line)
### Detailed Analysis or Content Details
**Top Chart (Throughput):**
The throughput line starts at approximately 7.0 x 10<sup>6</sup> bit/sec at 200 seconds. It steadily increases to around 8.5 x 10<sup>6</sup> bit/sec by 350 seconds. There is a sharp increase to approximately 14.5 x 10<sup>6</sup> bit/sec around 400 seconds, followed by a rapid decrease back to approximately 9.0 x 10<sup>6</sup> bit/sec by 550 seconds. After 550 seconds, the throughput stabilizes around 9.0 x 10<sup>6</sup> bit/sec, with minor fluctuations, until 1000 seconds.
**Bottom Chart (Packet Delay):**
* **OSPF (solid line):** Starts at approximately 0.032 sec at 200 seconds, remains relatively stable until around 400 seconds, then increases sharply to a peak of approximately 0.056 sec at 450 seconds. It then decreases rapidly, stabilizing around 0.034 sec by 600 seconds and remaining relatively constant until 1000 seconds.
* **SPF (dashed line):** Starts at approximately 0.033 sec at 200 seconds, increases to around 0.036 sec by 400 seconds, then experiences a significant spike to approximately 0.054 sec at 450 seconds. It then declines to around 0.035 sec by 600 seconds and remains relatively stable.
* **BF (dotted line):** Starts at approximately 0.031 sec at 200 seconds, remains relatively stable until 400 seconds, then increases to approximately 0.042 sec at 450 seconds. It then decreases to around 0.033 sec by 600 seconds and remains relatively stable.
* **Q-R (dash-dot line):** Starts at approximately 0.032 sec at 200 seconds, remains relatively stable until 400 seconds, then increases to approximately 0.045 sec at 450 seconds. It then decreases to around 0.034 sec by 600 seconds and remains relatively stable.
* **PQ-R (long dash-dot line):** Starts at approximately 0.031 sec at 200 seconds, remains relatively stable until 400 seconds, then increases to approximately 0.040 sec at 450 seconds. It then decreases to around 0.033 sec by 600 seconds and remains relatively stable.
* **AntNet (dashed line):** Starts at approximately 0.033 sec at 200 seconds, remains relatively stable until 400 seconds, then increases to approximately 0.048 sec at 450 seconds. It then decreases to around 0.035 sec by 600 seconds and remains relatively stable.
* **Daemon (dotted line):** Starts at approximately 0.030 sec at 200 seconds, remains relatively stable until 400 seconds, then increases to approximately 0.038 sec at 450 seconds. It then decreases to around 0.032 sec by 600 seconds and remains relatively stable.
### Key Observations
* The throughput spike around 400 seconds coincides with a significant increase in packet delay for all routing protocols.
* OSPF exhibits the highest peak packet delay among all protocols.
* Daemon consistently maintains the lowest packet delay throughout the simulation.
* After the initial spike, packet delay for all protocols stabilizes around a similar level (approximately 0.033-0.036 sec).
### Interpretation
The data suggests a trade-off between throughput and packet delay. The initial increase in throughput may be due to the network reaching a stable state. The sudden spike in throughput around 400 seconds, followed by a drop, likely represents a network event (e.g., congestion, route change) that temporarily increases data transfer rates but also introduces significant delays. The subsequent stabilization of both throughput and packet delay indicates the network adapting to the new conditions.
The varying packet delay performance of different routing protocols highlights their efficiency in handling network congestion. Daemon's consistently low delay suggests it is more resilient to congestion, while OSPF's higher delay indicates it may be more susceptible. The similar stabilization of packet delay across protocols after the initial spike suggests that all protocols eventually adapt to the network conditions, but with different levels of performance. The data could be used to evaluate and compare the performance of different routing protocols under varying network conditions.