## Dual-Axis Line Chart: Network Routing Protocol Performance Under Load
### Overview
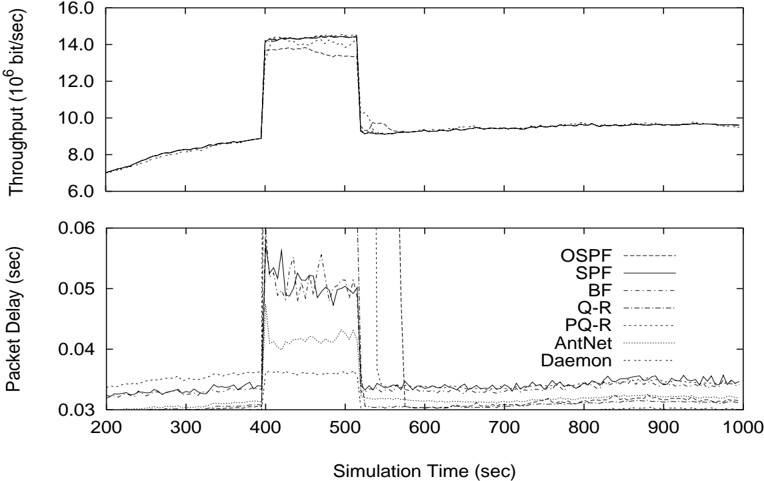
The image displays a technical performance comparison of seven network routing protocols over a simulated time period. It consists of two vertically stacked line charts sharing a common x-axis (Simulation Time). The top chart measures network throughput, and the bottom chart measures packet delay. A significant event, likely a congestion or failure scenario, occurs between approximately 400 and 520 seconds, causing dramatic changes in the performance metrics for most protocols.
### Components/Axes
* **Chart Type:** Dual-axis line chart (two subplots).
* **X-Axis (Shared):** Label: `Simulation Time (sec)`. Scale: Linear, from 200 to 1000 seconds, with major ticks every 100 seconds.
* **Top Subplot Y-Axis:** Label: `Throughput (10^6 bit/sec)`. Scale: Linear, from 6.0 to 16.0, with major ticks every 2.0 units.
* **Bottom Subplot Y-Axis:** Label: `Packet Delay (sec)`. Scale: Linear, from 0.03 to 0.06, with major ticks every 0.01 seconds.
* **Legend:** Positioned in the bottom-right corner of the *bottom subplot*. It lists seven protocols with corresponding line styles:
* `OSPF`: Dashed line (`---`)
* `SPF`: Solid line (`—`)
* `BF`: Dash-dot line (`-.-.`)
* `Q-R`: Dotted line (`...`)
* `PQ-R`: Dash-dot-dot line (`-..-..`)
* `AntNet`: Densely dotted line (finer dots than Q-R)
* `Daemon`: Long-dashed line (`- - -`)
### Detailed Analysis
**1. Top Subplot: Throughput Analysis**
* **General Trend (200-400 sec):** All protocols show a gradual, nearly identical increase in throughput from ~7.0 to ~8.8 Mbit/sec.
* **Event Period (400-520 sec):** A sharp, near-vertical increase occurs for all protocols.
* **OSPF & SPF:** Reach the highest plateau, approximately 14.2 - 14.5 Mbit/sec.
* **Other Protocols (BF, Q-R, PQ-R, AntNet, Daemon):** Plateau at a slightly lower level, approximately 13.5 - 14.0 Mbit/sec.
* **Post-Event (520-1000 sec):** Throughput for all protocols drops sharply and stabilizes at a new, higher baseline than the pre-event period, around 9.5 - 9.8 Mbit/sec. The lines are tightly clustered, showing minimal difference between protocols in this phase.
**2. Bottom Subplot: Packet Delay Analysis**
* **General Trend (200-400 sec):** Delays are low and stable, clustered between 0.030 and 0.035 seconds. `OSPF` and `SPF` are at the lower end of this range.
* **Event Period (400-520 sec):** A dramatic spike in delay occurs, with significant differentiation between protocols.
* **OSPF & SPF:** Exhibit the highest and most volatile delays, spiking to the chart's upper limit of 0.06 sec and fluctuating heavily between ~0.048 and 0.06 sec.
* **BF, Q-R, PQ-R:** Show a moderate increase, stabilizing around 0.040 - 0.043 sec.
* **AntNet & Daemon:** Show the smallest increase, remaining relatively stable near 0.035 - 0.037 sec.
* **Post-Event (520-1000 sec):** Delays for all protocols drop and converge to a narrow band between 0.030 and 0.035 sec, similar to the pre-event state. `OSPF` and `SPF` remain slightly higher than the others.
### Key Observations
1. **Correlated Event:** A system-wide event at t=400 sec triggers a simultaneous, massive increase in throughput and packet delay, indicating a period of high load or congestion.
2. **Protocol Differentiation Under Stress:** The primary performance differentiation between protocols occurs *during* the high-load event (400-520 sec), not during normal operation.
3. **Throughput vs. Delay Trade-off:** Protocols achieving the highest throughput during the event (`OSPF`, `SPF`) also suffer the highest and most unstable packet delays. Protocols with more moderate throughput increases (`AntNet`, `Daemon`) maintain much lower and more stable delays.
4. **Recovery and New Equilibrium:** All protocols successfully recover after the event (t=520 sec) and settle into a new stable state with higher throughput than the initial phase, but with delays returning to near-initial levels.
### Interpretation
This data visualizes a classic network performance trade-off under stress. The event between 400-520 seconds likely simulates a sudden surge in traffic or a link failure that forces rerouting.
* **OSPF and SPF** appear to be aggressive, throughput-optimizing protocols. They successfully maximize bandwidth utilization during the crisis (high throughput) but at the severe cost of increased latency and jitter (high, volatile delay), which could be detrimental to real-time applications.
* **AntNet and Daemon** demonstrate a more conservative or balanced approach. They sacrifice some peak throughput to maintain significantly better and more stable latency performance during congestion, suggesting better Quality of Service (QoS) guarantees.
* **BF, Q-R, and PQ-R** occupy a middle ground.
* The post-event convergence suggests that once the acute stressor is removed, the network's capacity and routing tables stabilize, allowing all protocols to perform similarly well, albeit at a higher throughput level than the initial state (possibly due to learned routes or cached paths).
**Conclusion:** The chart effectively argues that protocol choice is critical during network anomalies. There is no single "best" protocol; the optimal choice depends on whether the application prioritizes maximum raw throughput (favoring OSPF/SPF) or low, stable latency (favoring AntNet/Daemon) during periods of high load.