## Line Graph and Bar Chart: Active-Agent Fraction and Agents per Subtask Across Agent Society Sizes
### Overview
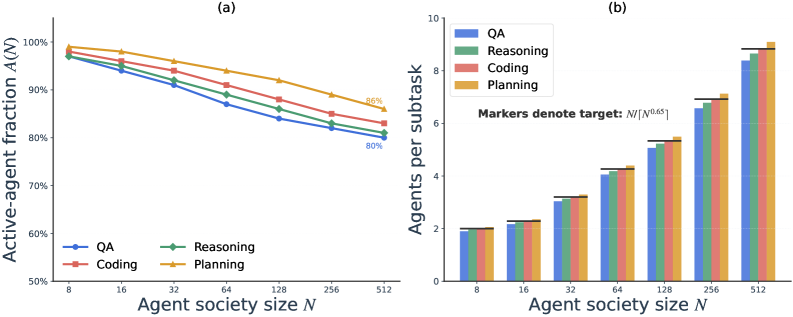
The image contains two charts analyzing the relationship between agent society size (N) and two metrics: (a) the active-agent fraction (A(N)) and (b) agents per subtask. Both charts use agent society sizes (N = 8, 16, 32, 64, 128, 256, 512) on the x-axis and distinct metrics on the y-axis. Four task categories (QA, Reasoning, Coding, Planning) are compared using color-coded lines (a) and bars (b).
---
### Components/Axes
#### Chart (a): Line Graph
- **X-axis**: "Agent society size N" (logarithmic scale: 8, 16, 32, 64, 128, 256, 512).
- **Y-axis**: "Active-agent fraction A(N)" (percentage, 50%–100%).
- **Legend**:
- QA (blue, circles)
- Reasoning (green, diamonds)
- Coding (red, squares)
- Planning (orange, triangles)
- **Markers**: Each category uses distinct geometric shapes for data points.
#### Chart (b): Bar Chart
- **X-axis**: "Agent society size N" (same logarithmic scale as Chart (a)).
- **Y-axis**: "Agents per subtask" (0–10, linear scale).
- **Legend**: Same four categories as Chart (a), with color coding.
---
### Detailed Analysis
#### Chart (a): Active-Agent Fraction Trends
- **Planning (orange)**: Starts at ~99% (N=8) and declines to ~86% (N=512). Slope is consistently downward but flattens slightly at larger N.
- **Coding (red)**: Begins at ~96% (N=8) and drops to ~84% (N=512). Steeper decline than Planning.
- **Reasoning (green)**: Starts at ~94% (N=8) and falls to ~82% (N=512). Similar trend to Coding.
- **QA (blue)**: Declines from ~95% (N=8) to ~80% (N=512). Most pronounced drop among all categories.
#### Chart (b): Agents per Subtask Trends
- **Planning (orange)**: Tallest bars across all N. Values increase from ~2 (N=8) to ~9.8 (N=512).
- **Coding (red)**: Second tallest. Rises from ~2 (N=8) to ~8.8 (N=512).
- **Reasoning (green)**: Third tallest. Grows from ~2 (N=8) to ~7.5 (N=512).
- **QA (blue)**: Shortest bars. Increases from ~1.8 (N=8) to ~8.0 (N=512).
---
### Key Observations
1. **Active-Agent Fraction (Chart a)**:
- All categories show a decline in active-agent fraction as N increases.
- Planning maintains the highest active fraction throughout, suggesting it is the most robust task under scaling.
- QA experiences the steepest decline, indicating sensitivity to larger society sizes.
2. **Agents per Subtask (Chart b)**:
- All categories require more agents as N grows, with Planning demanding the most resources.
- The gap between Planning and other categories widens at larger N (e.g., at N=512, Planning requires ~9.8 agents vs. QA’s ~8.0).
---
### Interpretation
- **Scalability Trade-offs**:
- Larger agent societies reduce the proportion of active agents across tasks, but Planning remains the most efficient, possibly due to its structured nature.
- The bar chart implies that Planning’s effectiveness scales with society size, requiring exponentially more agents to maintain performance. This could reflect complex coordination needs.
- **Task-Specific Dynamics**:
- QA’s sharp decline in active fraction (Chart a) and moderate agent growth (Chart b) suggest it may rely on fewer but highly specialized agents.
- Coding and Reasoning show intermediate trends, balancing resource use and scalability.
- **Anomalies**:
- No outliers detected; trends are consistent across all N values.
- The logarithmic x-axis in both charts emphasizes exponential growth in society size, highlighting scalability challenges.
---
### Spatial Grounding & Verification
- **Legend Placement**: Right-aligned in both charts, ensuring clear color-to-category mapping.
- **Data Point Consistency**:
- Chart (a): Orange (Planning) lines and markers align with the legend; no mismatches.
- Chart (b): Bar colors match legend labels exactly.
- **Trend Verification**:
- Chart (a): All lines slope downward; Planning’s decline is the gentlest.
- Chart (b): Bars increase monotonically with N for all categories.
---
### Conclusion
The data demonstrates that Planning is the most scalable and resource-intensive task, maintaining higher active-agent fractions while requiring exponentially more agents in larger societies. QA, while initially efficient, becomes less viable as society size grows. These insights suggest task-specific optimization strategies for agent-based systems.