## Heatmap: Periodic Pattern
### Overview
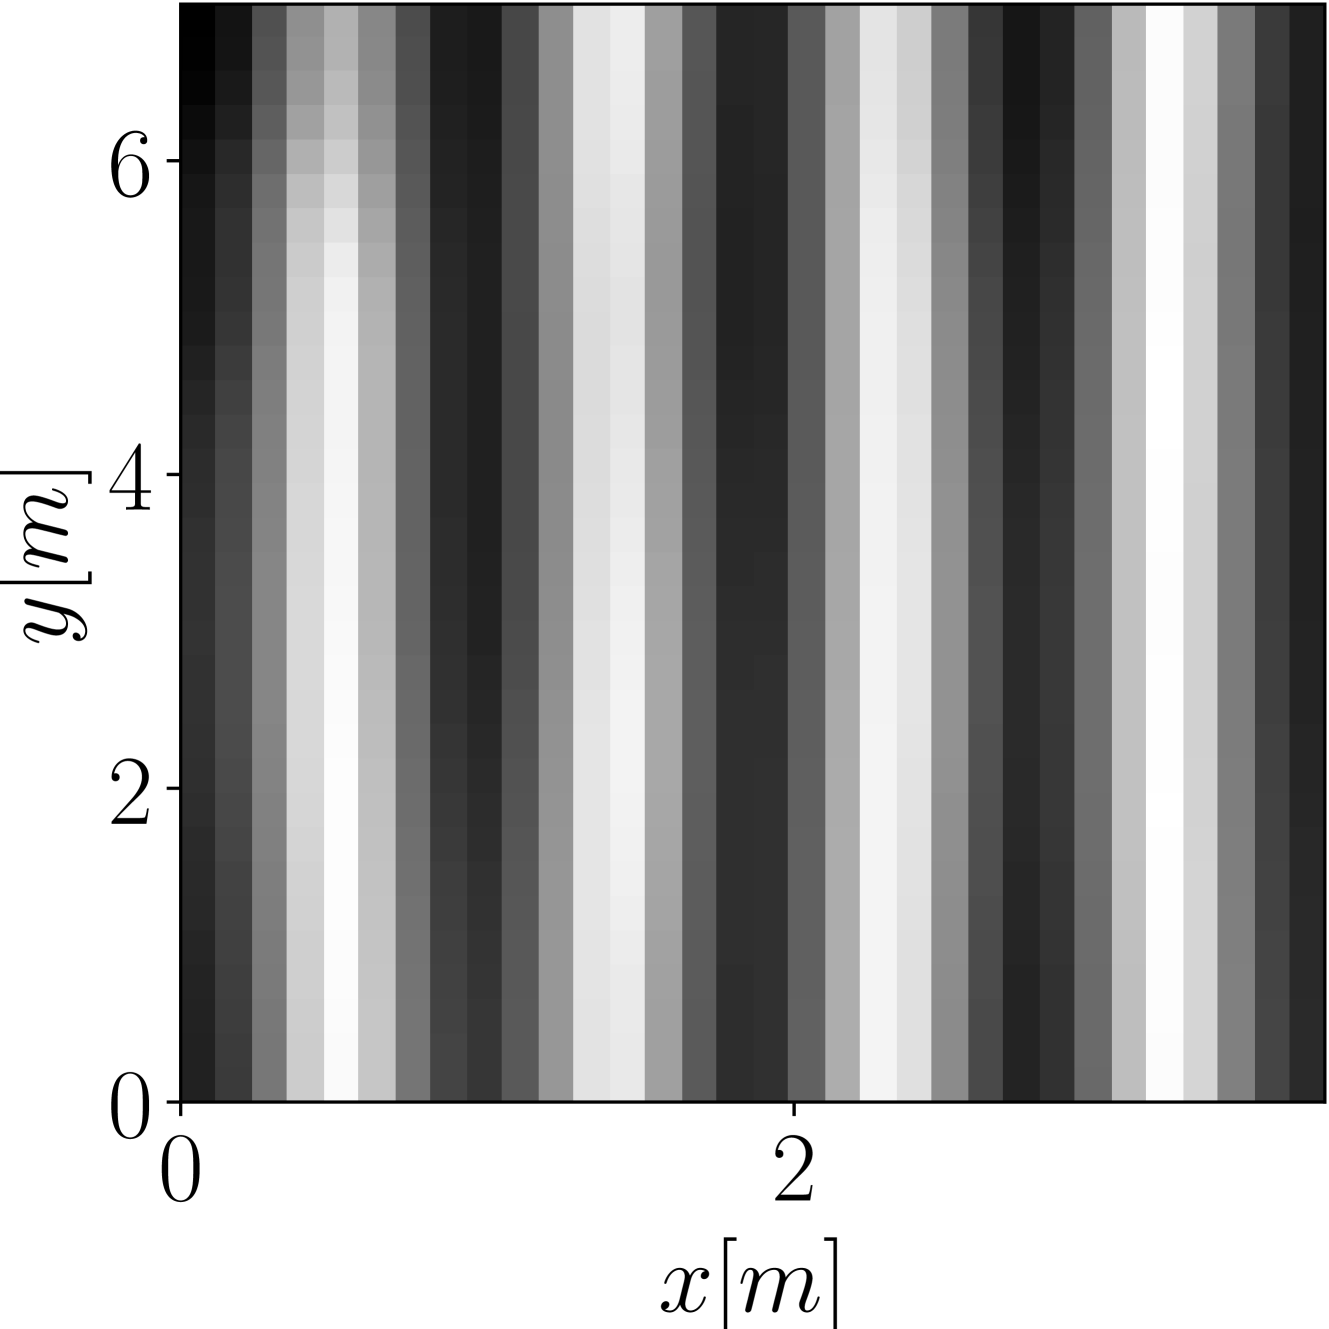
The image is a heatmap displaying a periodic pattern. The x-axis represents distance in meters, ranging from 0 to 2 meters. The y-axis represents distance in meters, ranging from 0 to 6 meters. The heatmap shows alternating vertical bands of varying shades of gray, indicating a periodic variation in some underlying quantity.
### Components/Axes
* **X-axis:**
* Label: x[m] (x-axis, distance in meters)
* Scale: 0 to 2 meters
* Markers: 0, 2
* **Y-axis:**
* Label: y[m] (y-axis, distance in meters)
* Scale: 0 to 6 meters
* Markers: 0, 2, 4, 6
* **Color Scale:** The heatmap uses a grayscale color scheme, with darker shades representing lower values and lighter shades representing higher values. There is no explicit colorbar or legend provided.
### Detailed Analysis
The heatmap consists of vertical bands of varying shades of gray. These bands alternate between darker and lighter shades, creating a periodic pattern. The bands appear to be roughly uniform in width.
* **Vertical Bands:** The bands run vertically, parallel to the y-axis.
* **Periodicity:** The pattern repeats consistently across the x-axis. The width of each cycle (dark band + light band) appears to be approximately 0.5 meters.
* **Shade Variation:** The shades of gray vary smoothly within each band, with no abrupt transitions.
### Key Observations
* The heatmap shows a clear periodic pattern along the x-axis.
* The pattern is consistent across the entire y-axis range.
* The absence of a colorbar makes it difficult to determine the exact values represented by the different shades of gray.
### Interpretation
The heatmap likely represents a physical quantity that varies periodically in space. The x-axis represents the spatial dimension along which the quantity varies, and the y-axis represents another spatial dimension. The alternating bands of gray indicate regions of high and low values of the quantity.
Possible interpretations include:
* **Wave Interference:** The heatmap could represent the interference pattern of two or more waves. The bands would correspond to regions of constructive and destructive interference.
* **Material Property Variation:** The heatmap could represent the spatial variation of a material property, such as density or conductivity. The bands would correspond to regions of high and low values of the property.
* **Light Intensity:** The heatmap could represent the intensity of light in a scene. The bands would correspond to regions of high and low light intensity.
Without additional information, it is impossible to determine the exact physical quantity represented by the heatmap. However, the periodic pattern suggests that it is related to a wave phenomenon or a spatially varying material property.