\n
## Heatmap: Spatial Distribution
### Overview
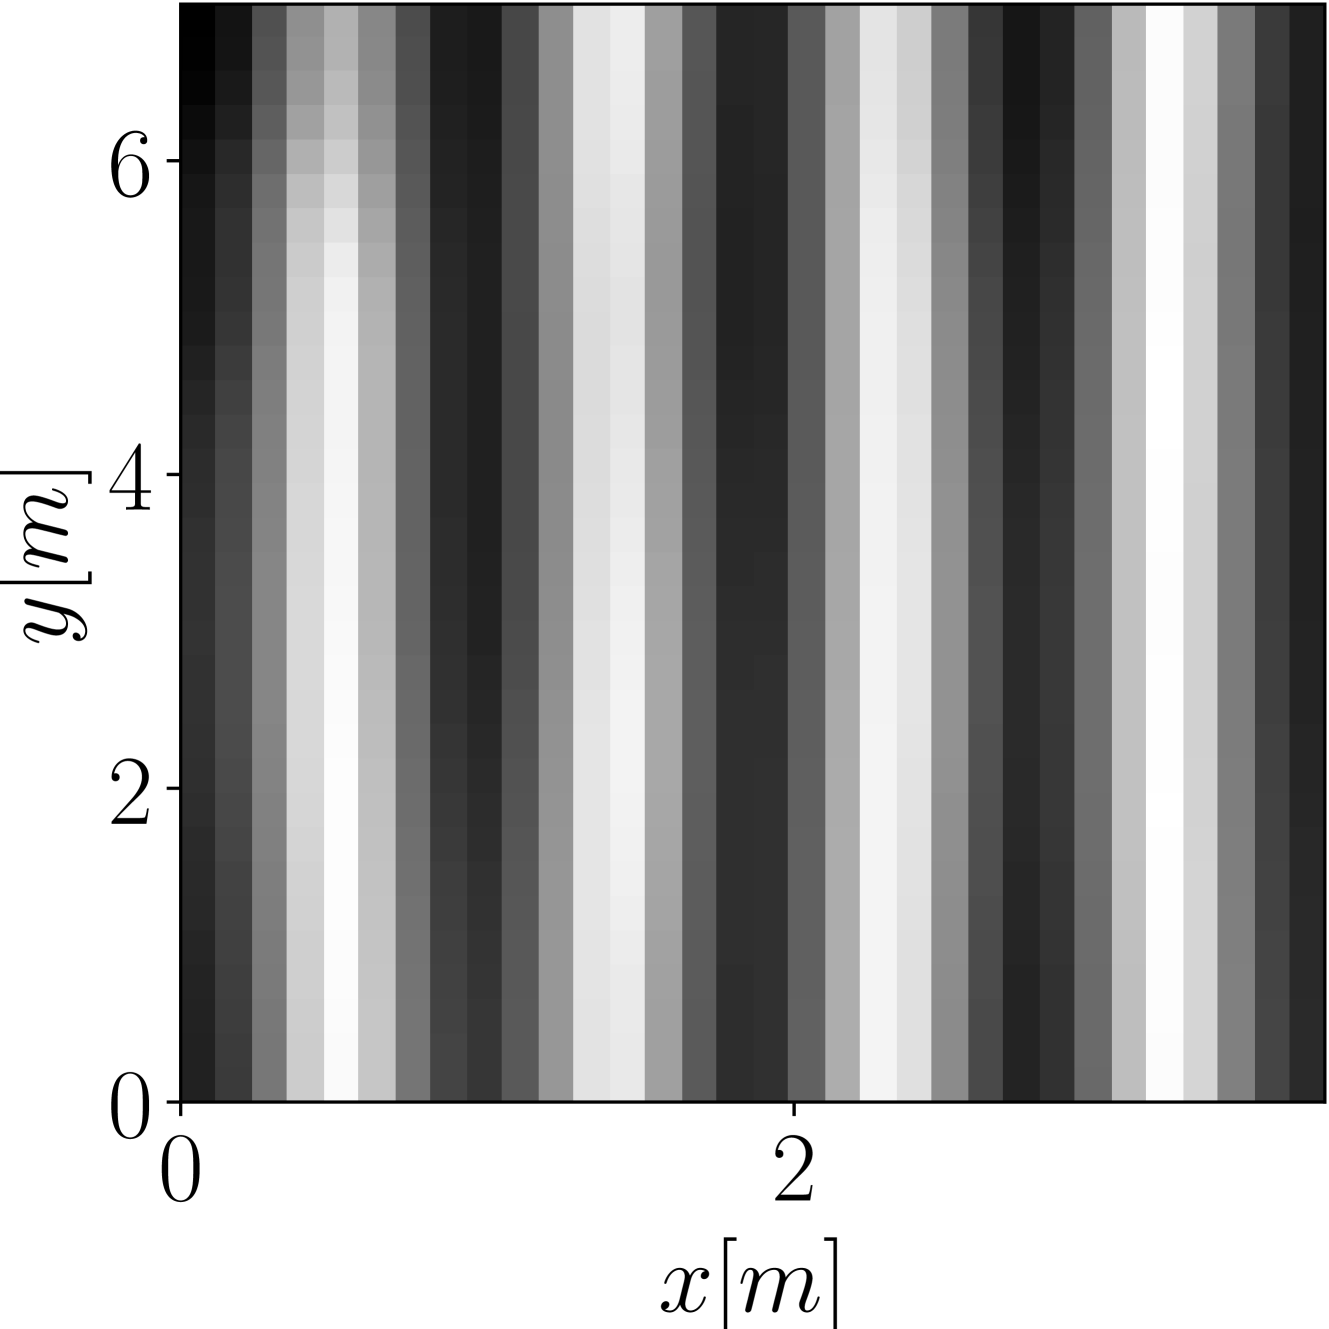
The image presents a heatmap visualizing a spatial distribution. The heatmap displays intensity variations across a two-dimensional space defined by x and y coordinates, both measured in meters (m). The intensity is represented by a grayscale color scheme, with darker shades indicating lower values and lighter shades indicating higher values. The data appears to be periodic in the x-direction, forming a series of vertical stripes.
### Components/Axes
* **X-axis:** Labeled "x [m]", ranging from approximately 0 to 2.5 meters.
* **Y-axis:** Labeled "y [m]", ranging from approximately 0 to 6.5 meters.
* **Color Scale:** Grayscale, with darker shades representing lower values and lighter shades representing higher values. There is no explicit colorbar or legend provided, so the exact mapping between color and value is unknown.
* **Data Representation:** The heatmap consists of rectangular cells, each representing a data point at a specific (x, y) coordinate.
### Detailed Analysis
The heatmap exhibits a clear periodic pattern in the x-direction. Vertical stripes of varying intensity are visible. The stripes are approximately 0.25 meters wide.
* **Stripes:** The intensity of the stripes alternates between darker and lighter shades.
* **Y-axis Variation:** The intensity of the stripes appears relatively consistent along the y-axis, although there might be subtle variations.
* **Approximate Intensity Levels (based on visual inspection):**
* Darkest stripes: Intensity approximately 10-20 (arbitrary units, as no scale is provided).
* Lightest stripes: Intensity approximately 80-90 (arbitrary units).
* Intermediate stripes: Intensity approximately 40-60 (arbitrary units).
* **Stripes positions (approximate):**
* x = 0.05m - 0.3m: Dark stripe
* x = 0.35m - 0.6m: Light stripe
* x = 0.65m - 0.9m: Dark stripe
* x = 0.95m - 1.2m: Light stripe
* x = 1.25m - 1.5m: Dark stripe
* x = 1.55m - 1.8m: Light stripe
* x = 1.85m - 2.1m: Dark stripe
* x = 2.15m - 2.4m: Light stripe
* x = 2.45m - 2.7m: Dark stripe
### Key Observations
* The dominant feature is the periodic pattern of alternating light and dark stripes.
* The stripes are aligned vertically (parallel to the y-axis).
* The intensity variation appears to be primarily in the x-direction.
* The lack of a colorbar makes it difficult to quantify the intensity values precisely.
### Interpretation
The heatmap likely represents a spatial distribution of some physical quantity that exhibits a periodic variation. This could be:
* **Interference Pattern:** The pattern could represent an interference pattern, such as that created by waves (e.g., sound waves, light waves). The stripes would correspond to regions of constructive and destructive interference.
* **Periodic Structure:** The pattern could represent a periodic structure, such as a grating or a series of regularly spaced objects.
* **Field Distribution:** The pattern could represent the distribution of a field (e.g., electric field, magnetic field) in a region with periodic boundaries or sources.
Without additional information about the context of the heatmap, it is difficult to determine the exact meaning of the data. The periodic nature of the pattern suggests that the underlying phenomenon is governed by some form of periodicity. The absence of a colorbar limits the ability to perform quantitative analysis.