## Heatmap: Periodic Pattern Visualization
### Overview
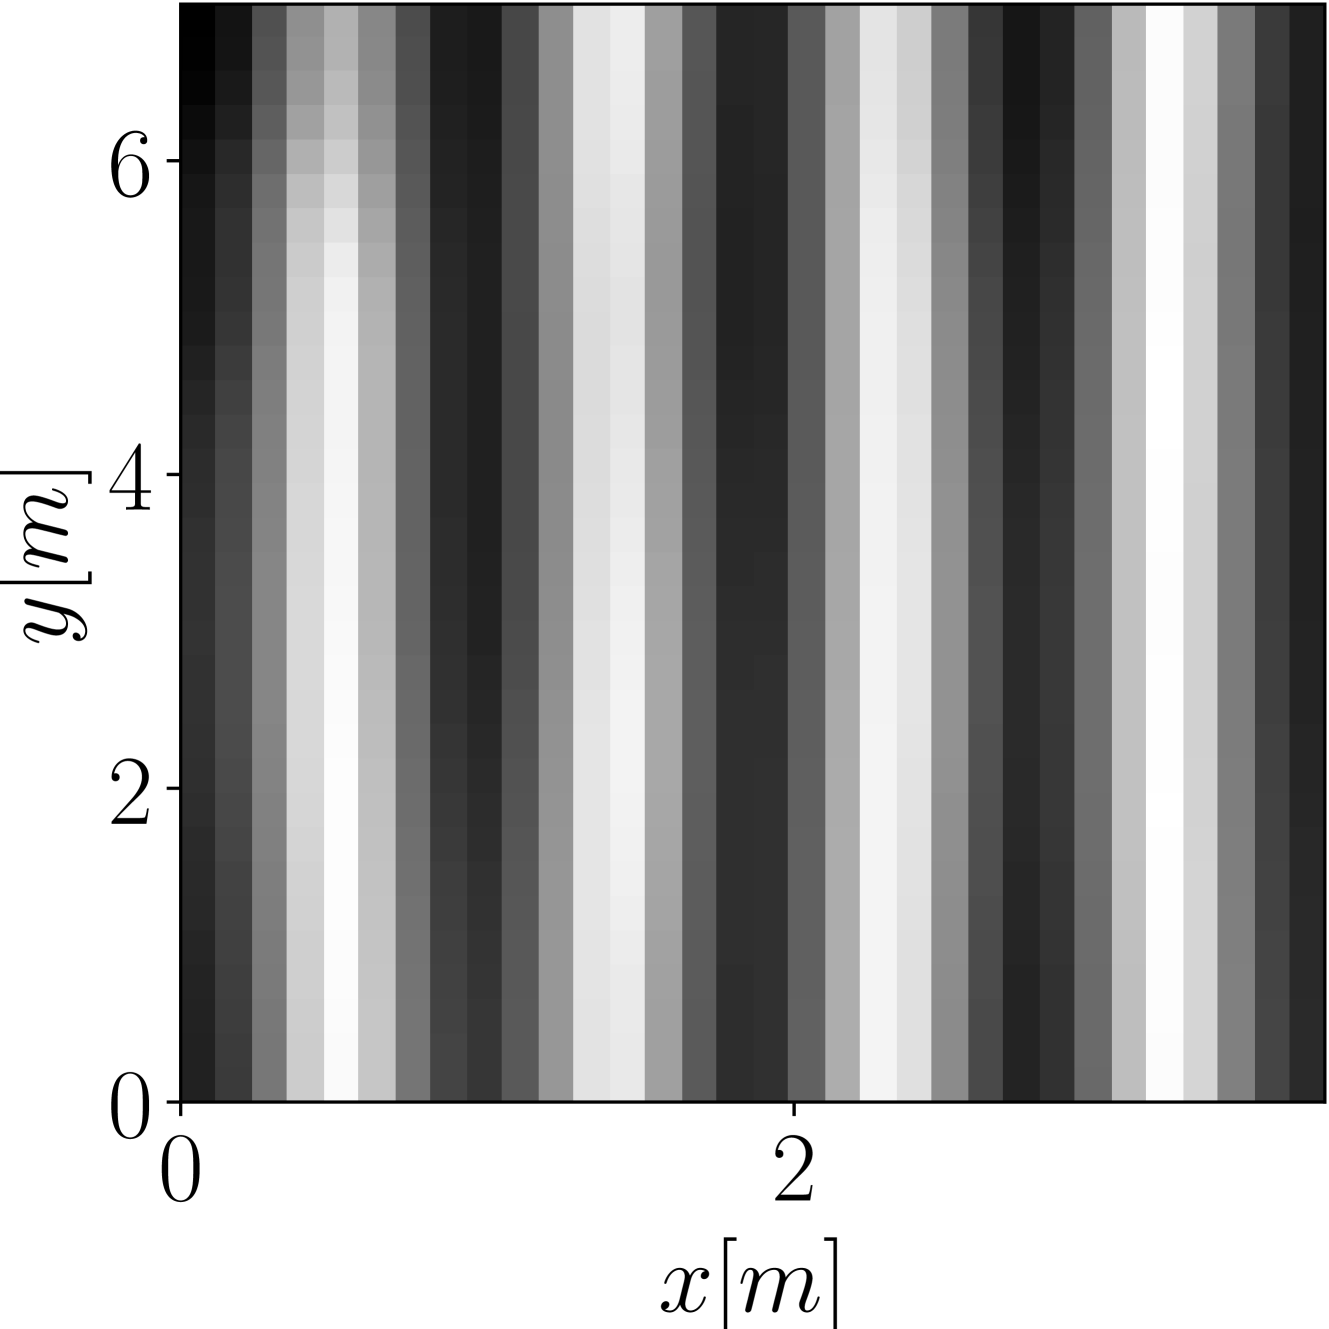
The image is a grayscale heatmap with vertical stripes of alternating intensity. The x-axis is labeled `x[m]` (meters) with a range of 0 to 2, and the y-axis is labeled `y[m]` with a range of 0 to 6. No legend or colorbar is present. The stripes exhibit a periodic pattern along the x-axis, with consistent width and alternating shading from black (darkest) to white (lightest).
### Components/Axes
- **X-axis**:
- Label: `x[m]` (meters)
- Scale: 0 to 2, with ticks at 0 and 2.
- No intermediate labels or subdivisions.
- **Y-axis**:
- Label: `y[m]` (meters)
- Scale: 0 to 6, with ticks at 0, 2, 4, and 6.
- No intermediate labels or subdivisions.
- **Heatmap**:
- Vertical stripes dominate the visualization.
- Shading alternates between dark (black) and light (white), suggesting a scalar value (e.g., intensity, amplitude) encoded in grayscale.
- No legend or colorbar to quantify the grayscale mapping.
### Detailed Analysis
- **Stripe Dimensions**:
- Each vertical stripe spans the full y-axis (0–6 m).
- Stripe width ≈ 0.2 m (calculated as 2 m total x-axis range / 10 stripes).
- **Shading Pattern**:
- Alternating dark-to-light stripes repeat every 0.2 m along the x-axis.
- No gradient transitions between stripes; shading is uniform within each stripe.
- **Missing Elements**:
- No legend, colorbar, or annotations to explain the grayscale values.
- No text or labels within the heatmap itself.
### Key Observations
1. **Periodicity**: The repeating stripe pattern suggests a sinusoidal or wave-like function with a period of 0.2 m.
2. **Uniformity**: Consistent stripe width and shading imply a controlled or theoretical model (e.g., interference, standing waves).
3. **Ambiguity**: Without a legend or colorbar, the exact meaning of the grayscale values (e.g., intensity, probability) remains undefined.
### Interpretation
The heatmap likely represents a **periodic scalar field** (e.g., wave amplitude, pressure distribution) with a spatial frequency of 5 cycles per meter (1/0.2 m). The alternating shading could correspond to constructive/destructive interference or a standing wave pattern. The absence of a legend limits quantitative interpretation, but the uniformity and periodicity suggest a deterministic relationship between x and y. This could model phenomena like acoustic waves, electromagnetic fields, or mechanical vibrations in a controlled environment.
## Notes
- Language: English (no non-English text present).
- Spatial grounding: All elements are axis-aligned; no rotated or skewed components.
- Trend verification: The periodic pattern is visually confirmed by the repeating stripe intervals and consistent shading.