# Technical Document Extraction
## Section a: Histograms
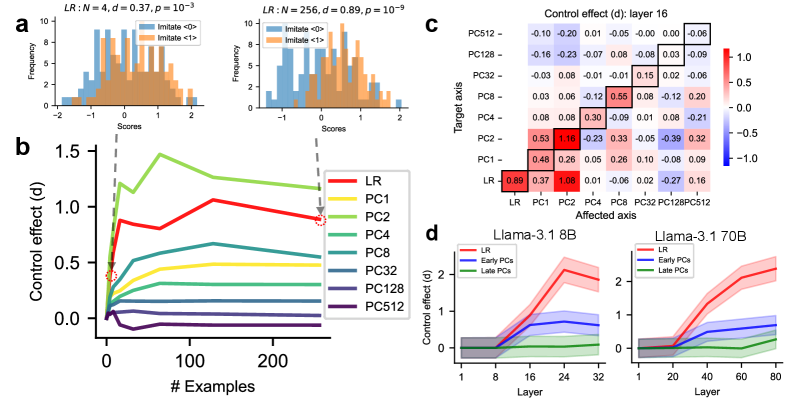
### Left Histogram
- **Parameters**: `LR: N = 4, d = 0.37, p = 10⁻³`
- **Axes**:
- **x-axis**: Scores (range: -2 to 2)
- **y-axis**: Frequency (range: 0 to 2)
- **Legend**:
- **Blue**: Immediate <0>
- **Orange**: Immediate <1>
- **Key Observations**:
- Blue bars dominate negative scores (-2 to -1).
- Orange bars peak at score 1.
### Right Histogram
- **Parameters**: `LR: N = 256, d = 0.89, p = 10⁻³`
- **Axes**:
- **x-axis**: Scores (range: -1 to 2)
- **y-axis**: Frequency (range: 0 to 2)
- **Legend**:
- **Blue**: Immediate <0>
- **Orange**: Immediate <1>
- **Key Observations**:
- Blue bars concentrated at score 0.
- Orange bars peak at score 1.
---
## Section b: Line Graph (Control Effect vs. Examples)
- **Axes**:
- **x-axis**: # Examples (0 to 200)
- **y-axis**: Control effect (d) (0 to 1.5)
- **Legend** (top-right):
- **Red**: LR
- **Yellow**: PC1
- **Green**: PC2
- **Cyan**: PC4
- **Blue**: PC8
- **Purple**: PC32
- **Dark Purple**: PC128
- **Dark Green**: PC512
- **Trends**:
- **LR (Red)**: Starts at 0, peaks at ~0.8 (100 examples), dips to ~0.6 (200 examples).
- **PC1 (Yellow)**: Similar to LR but less pronounced.
- **PC2 (Green)**: Peaks at ~1.2 (100 examples), declines to ~0.8 (200 examples).
- **PC4 (Cyan)**: Gradual rise to ~0.6 (200 examples).
- **PC8 (Blue)**: Flat at ~0.4.
- **PC32 (Purple)**: Flat at ~0.3.
- **PC128 (Dark Purple)**: Flat at ~0.2.
- **PC512 (Dark Green)**: Flat at ~0.1.
- **Spatial Grounding**:
- Legend positioned at top-right of the plot.
---
## Section c: Heatmap (Control Effect Matrix)
- **Title**: Control effect (d): layer 16
- **Axes**:
- **Rows (Target Layers)**: PC128, PC32, PC8, PC4, PC2, PC1, LR
- **Columns (Affected Layers)**: PC128, PC32, PC8, PC4, PC2, PC1, LR
- **Color Scale**: Blue (-1.0) to Red (1.0)
- **Key Values**:
- **PC128 Row**:
- PC128: -0.10
- PC32: -0.16
- PC8: -0.03
- PC4: -0.03
- PC2: 0.08
- PC1: 0.48
- LR: 0.89
- **PC32 Row**:
- PC128: -0.03
- PC32: 0.08
- PC8: -0.12
- PC4: 0.30
- PC2: 1.16
- PC1: 0.53
- LR: 0.37
- **PC8 Row**:
- PC128: 0.03
- PC32: 0.06
- PC8: 0.06
- PC4: -0.09
- PC2: -0.23
- PC1: 0.26
- LR: 1.06
- **PC4 Row**:
- PC128: -0.03
- PC32: 0.08
- PC8: -0.09
- PC4: 0.01
- PC2: -0.06
- PC1: -0.02
- LR: 0.01
- **PC2 Row**:
- PC128: 0.03
- PC32: -0.12
- PC8: 0.08
- PC4: -0.06
- PC2: 0.01
- PC1: -0.27
- LR: 0.16
- **PC1 Row**:
- PC128: -0.06
- PC32: -0.21
- PC8: 0.08
- PC4: -0.27
- PC2: 0.16
- PC1: 0.16
- LR: 0.16
- **LR Row**:
- PC128: -0.06
- PC32: -0.21
- PC8: 0.08
- PC4: -0.27
- PC2: 0.16
- PC1: 0.16
- LR: 0.16
- **Spatial Grounding**:
- Color bar (blue to red) on the right of the heatmap.
---
## Section d: Line Graphs (Llama-3.1 8B and 70B)
### Llama-3.1 8B
- **Axes**:
- **x-axis**: Layer (0 to 80)
- **y-axis**: Control effect (d) (0 to 1.5)
- **Legend**:
- **Red**: LR
- **Blue**: Early PCs
- **Green**: Late PCs
- **Trends**:
- **LR (Red)**: Starts at 0, rises sharply to ~1.2 (layer 20), then plateaus.
- **Early PCs (Blue)**: Gradual rise to ~0.6 (layer 20), then declines.
- **Late PCs (Green)**: Flat at ~0.2.
### Llama-3.1 70B
- **Axes**:
- **x-axis**: Layer (0 to 80)
- **y-axis**: Control effect (d) (0 to 1.5)
- **Legend**:
- **Red**: LR
- **Blue**: Early PCs
- **Green**: Late PCs
- **Trends**:
- **LR (Red)**: Starts at 0, rises to ~1.0 (layer 40), then plateaus.
- **Early PCs (Blue)**: Gradual rise to ~0.5 (layer 40), then declines.
- **Late PCs (Green)**: Flat at ~0.1.
- **Spatial Grounding**:
- Legends positioned at top-right of each subplot.