## Diagram: Sliding Window Buffer Update
### Overview
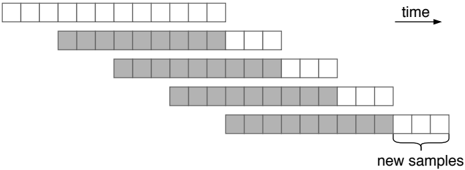
The image is a schematic diagram illustrating a temporal data processing mechanism, specifically a "sliding window" or buffer update process. It visualizes how a fixed-size data buffer is updated over five discrete time steps, where new data is shifted into the buffer while old data is discarded.
### Components/Axes
* **Data Rows:** There are five horizontal rows, each containing 12 rectangular boxes.
* **Shading:**
* **White Boxes:** Represent new or unpopulated data slots.
* **Grey Boxes:** Represent existing, processed, or populated data.
* **Labels:**
* **"time"**: Located at the top right, accompanied by an arrow pointing to the right, indicating the direction of temporal progression.
* **"new samples"**: Located at the bottom right, with a bracket spanning the final four boxes of the bottom-most row.
### Detailed Analysis
The diagram displays a consistent, staggered progression from top to bottom. Each row represents a subsequent time step.
* **Row 1 (Top):** Contains 12 white boxes. This represents the initial state or an empty buffer.
* **Row 2:** Contains 8 grey boxes followed by 4 white boxes. The row is shifted to the right by 3 units relative to Row 1.
* **Row 3:** Contains 8 grey boxes followed by 4 white boxes. The row is shifted to the right by 3 units relative to Row 2 (or 6 units relative to Row 1).
* **Row 4:** Contains 8 grey boxes followed by 4 white boxes. The row is shifted to the right by 3 units relative to Row 3 (or 9 units relative to Row 1).
* **Row 5 (Bottom):** Contains 8 grey boxes followed by 4 white boxes. The row is shifted to the right by 3 units relative to Row 4 (or 12 units relative to Row 1).
* **"New Samples" Bracket:** This bracket is positioned under the final 4 white boxes of the bottom row, explicitly identifying these as the incoming data points for that time step.
### Key Observations
* **Consistent Window Size:** The total number of boxes in each row remains constant at 12.
* **Fixed Update Rate:** The buffer shifts by exactly 3 units (or 25% of the total buffer size) at each time step.
* **Overlap:** The grey (processed) data persists across rows, shifting position, which is characteristic of overlapping window processing (e.g., in Short-Time Fourier Transforms or audio signal processing).
### Interpretation
This diagram demonstrates a **sliding window buffer update mechanism**.
In technical contexts, this is used to process continuous data streams in chunks. The "grey" area represents the data currently held in memory or the processing window. As time progresses (moving down the rows), the oldest data is dropped from the left, and new data (the "new samples") is shifted in from the right.
The specific overlap (3 units of shift for a 12-unit window) suggests a 75% overlap between consecutive processing windows. This technique is commonly employed in digital signal processing (DSP) to ensure continuity in data analysis, preventing edge artifacts or data loss that might occur if windows were processed without overlap.