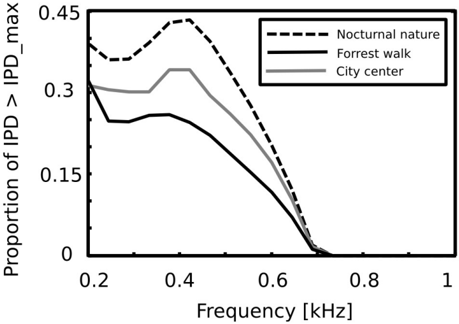
## Line Chart: Proportion of IPD > IPD_max vs. Frequency for Different Environments
### Overview
The image is a line chart comparing the proportion of Interaural Phase Difference (IPD) exceeding the maximum IPD (IPD_max) across different frequencies for three environments: "Nocturnal nature", "Forrest walk", and "City center". The x-axis represents frequency in kHz, and the y-axis represents the proportion of IPD > IPD_max.
### Components/Axes
* **X-axis:** Frequency [kHz]. Scale ranges from 0.2 to 1.0, with tick marks at 0.2, 0.4, 0.6, 0.8, and 1.0.
* **Y-axis:** Proportion of IPD > IPD_max. Scale ranges from 0 to 0.45, with tick marks at 0, 0.15, 0.3, and 0.45.
* **Legend:** Located in the top-right corner of the chart.
* "Nocturnal nature" - Dashed black line
* "Forrest walk" - Solid black line
* "City center" - Solid gray line
### Detailed Analysis
* **Nocturnal nature (Dashed Black Line):**
* Trend: Initially high, decreases rapidly with increasing frequency.
* Data Points:
* At 0.2 kHz, the proportion is approximately 0.42.
* At 0.4 kHz, the proportion is approximately 0.44.
* At 0.6 kHz, the proportion is approximately 0.10.
* At 0.7 kHz, the proportion is approximately 0.01.
* **Forrest walk (Solid Black Line):**
* Trend: Starts lower than "Nocturnal nature", decreases with increasing frequency.
* Data Points:
* At 0.2 kHz, the proportion is approximately 0.31.
* At 0.4 kHz, the proportion is approximately 0.27.
* At 0.6 kHz, the proportion is approximately 0.05.
* At 0.7 kHz, the proportion is approximately 0.00.
* **City center (Solid Gray Line):**
* Trend: Starts between "Nocturnal nature" and "Forrest walk", decreases with increasing frequency.
* Data Points:
* At 0.2 kHz, the proportion is approximately 0.30.
* At 0.4 kHz, the proportion is approximately 0.33.
* At 0.6 kHz, the proportion is approximately 0.05.
* At 0.7 kHz, the proportion is approximately 0.00.
### Key Observations
* All three environments show a decreasing proportion of IPD > IPD_max as frequency increases.
* "Nocturnal nature" consistently has the highest proportion of IPD > IPD_max across the lower frequency range (0.2 kHz to 0.6 kHz).
* "Forrest walk" has the lowest proportion of IPD > IPD_max in the lower frequency range.
* All three lines converge to approximately 0 at around 0.7 kHz.
### Interpretation
The chart suggests that the proportion of IPD exceeding IPD_max is frequency-dependent and varies across different environments. The "Nocturnal nature" environment exhibits a higher proportion of IPD > IPD_max at lower frequencies compared to "Forrest walk" and "City center". This could be due to the specific soundscapes of these environments, with "Nocturnal nature" potentially having more low-frequency sounds that contribute to larger IPD values. The convergence of all lines to zero at higher frequencies indicates that the proportion of IPD exceeding IPD_max becomes negligible at these frequencies, regardless of the environment. This data could be relevant in understanding how different environments affect auditory processing and spatial hearing.