\n
## Line Chart: Proportion of IPD > IPD_max vs. Frequency
### Overview
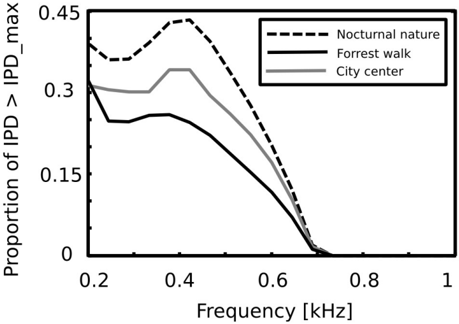
This image presents a line chart illustrating the proportion of Interaural Phase Difference (IPD) exceeding the maximum IPD (IPD_max) across different frequency ranges for three distinct environments: Nocturnal nature, Forrest walk, and City center. The chart aims to compare how sound localization cues vary in these environments.
### Components/Axes
* **X-axis:** Frequency [kHz], ranging from approximately 0.2 kHz to 1.0 kHz. The axis is labeled "Frequency [kHz]".
* **Y-axis:** Proportion of IPD > IPD_max, ranging from 0.0 to 0.45. The axis is labeled "Proportion of IPD > IPD_max".
* **Legend:** Located in the top-right corner of the chart.
* Nocturnal nature: Represented by a dashed black line.
* Forrest walk: Represented by a solid black line.
* City center: Represented by a light gray shaded area.
### Detailed Analysis
The chart displays three curves representing the proportion of IPD exceeding IPD_max for each environment as a function of frequency.
* **Nocturnal nature (dashed black line):** This line initially starts at approximately 0.36 at 0.2 kHz, rises to a peak of approximately 0.43 at around 0.38 kHz, and then declines, crossing 0.15 at approximately 0.65 kHz and approaching 0 at 0.8 kHz.
* **Forrest walk (solid black line):** This line begins at approximately 0.28 at 0.2 kHz, gradually decreases to approximately 0.18 at 0.4 kHz, and then rapidly declines, reaching approximately 0.05 at 0.6 kHz and approaching 0 at 0.7 kHz.
* **City center (light gray shaded area):** This area starts at approximately 0.30 at 0.2 kHz, remains relatively stable until approximately 0.4 kHz, and then gradually decreases, reaching approximately 0.10 at 0.6 kHz and approaching 0 at 0.8 kHz. The shaded area represents a range of values, indicating variability within the City center environment.
### Key Observations
* The Nocturnal nature environment exhibits the highest proportion of IPD > IPD_max, particularly in the lower frequency range (0.2 - 0.4 kHz).
* The Forrest walk environment consistently shows the lowest proportion of IPD > IPD_max across all frequencies.
* The City center environment falls between the Nocturnal nature and Forrest walk environments, with a relatively stable proportion in the lower frequencies and a gradual decline as frequency increases.
* All three environments show a general trend of decreasing proportion of IPD > IPD_max as frequency increases.
### Interpretation
The data suggests that sound localization cues, as indicated by the proportion of IPD exceeding IPD_max, are most prominent in the Nocturnal nature environment and least prominent in the Forrest walk environment. This could be due to differences in sound reflection and absorption characteristics of these environments. The City center environment, with its complex soundscape, exhibits intermediate characteristics.
The decline in IPD proportion with increasing frequency across all environments is consistent with the physics of sound wave propagation. Higher frequencies have shorter wavelengths and are less susceptible to interaural time differences, which are the basis of IPD.
The variability represented by the shaded area for the City center environment likely reflects the diverse sound sources and acoustic conditions present in urban settings. This data could be used to inform the design of virtual auditory environments or to understand how humans perceive sound in different real-world settings. The peak in Nocturnal nature suggests a specific frequency range where sound localization is most effective in that environment.