## Line Chart: EGA vs Environment Step for Different Initial Conditions
### Overview
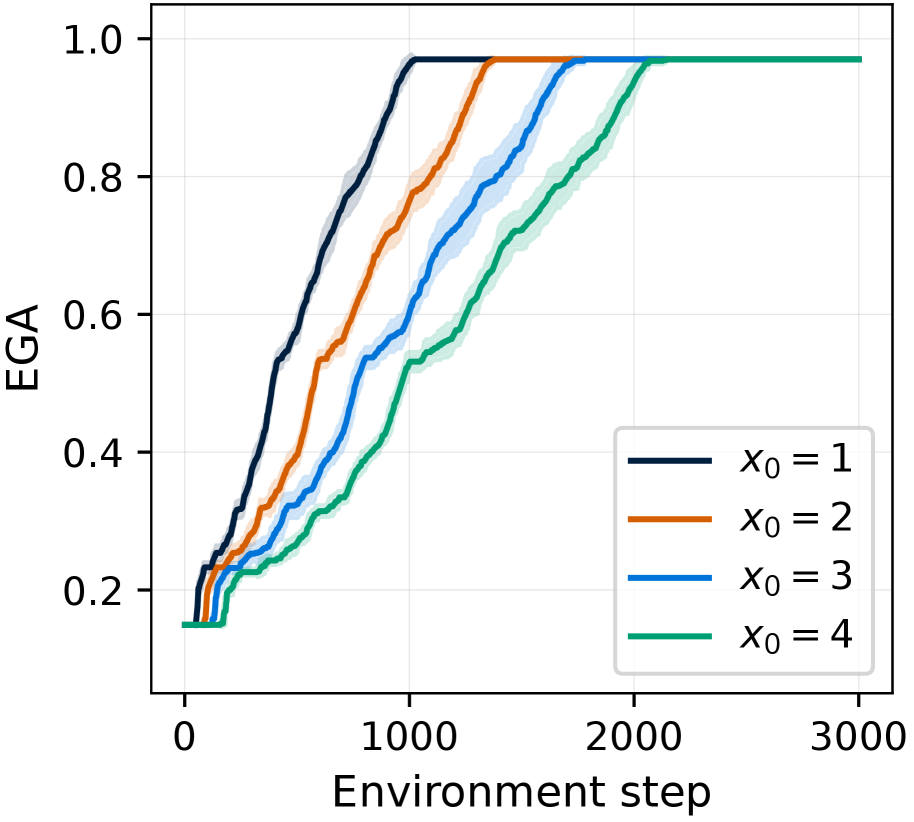
The image is a line chart that plots EGA (likely an abbreviation for an evaluation metric) against the Environment step. There are four lines on the chart, each representing a different initial condition denoted as x₀ = 1, x₀ = 2, x₀ = 3, and x₀ = 4. The chart shows how EGA changes with the environment step for each of these initial conditions. Each line has a shaded region around it, indicating the uncertainty or variance in the data.
### Components/Axes
* **Y-axis:** EGA, ranging from 0.0 to 1.0 with increments of 0.2.
* **X-axis:** Environment step, ranging from 0 to 3000 with an increment of 1000.
* **Legend (bottom-right):**
* Black line: x₀ = 1
* Orange line: x₀ = 2
* Blue line: x₀ = 3
* Green line: x₀ = 4
### Detailed Analysis
* **x₀ = 1 (Black):** The EGA starts at approximately 0.2 and rapidly increases to 0.6 by around environment step 500. It then continues to increase, reaching 0.95 by step 1000, and plateaus at approximately 0.98.
* **x₀ = 2 (Orange):** The EGA starts at approximately 0.2 and increases more gradually than x₀ = 1. It reaches 0.6 by around environment step 800, and plateaus at approximately 0.97 by step 1500.
* **x₀ = 3 (Blue):** The EGA starts at approximately 0.2 and increases similarly to x₀ = 2, but slightly slower. It reaches 0.6 by around environment step 1000, and plateaus at approximately 0.97 by step 2000.
* **x₀ = 4 (Green):** The EGA starts at approximately 0.15 and increases the slowest among all the conditions. It reaches 0.6 by around environment step 1200, and plateaus at approximately 0.97 by step 2200.
### Key Observations
* All four initial conditions eventually reach a similar EGA plateau value of approximately 0.97-0.98.
* The initial condition x₀ = 1 results in the fastest increase in EGA, while x₀ = 4 results in the slowest.
* The shaded regions around each line indicate some variability in the EGA for each initial condition.
### Interpretation
The chart demonstrates the impact of different initial conditions (x₀) on the learning rate or performance (EGA) of a system as it interacts with its environment. The initial condition x₀ = 1 leads to the quickest learning, while x₀ = 4 results in the slowest. However, all conditions eventually converge to a similar level of performance. This suggests that while the initial condition affects the speed of learning, it does not significantly impact the final performance level. The shaded regions indicate that there is some variability in the learning process, which could be due to factors such as randomness in the environment or the learning algorithm itself.