\n
## Line Chart: EGA vs. Environment Step for Different x0 Values
### Overview
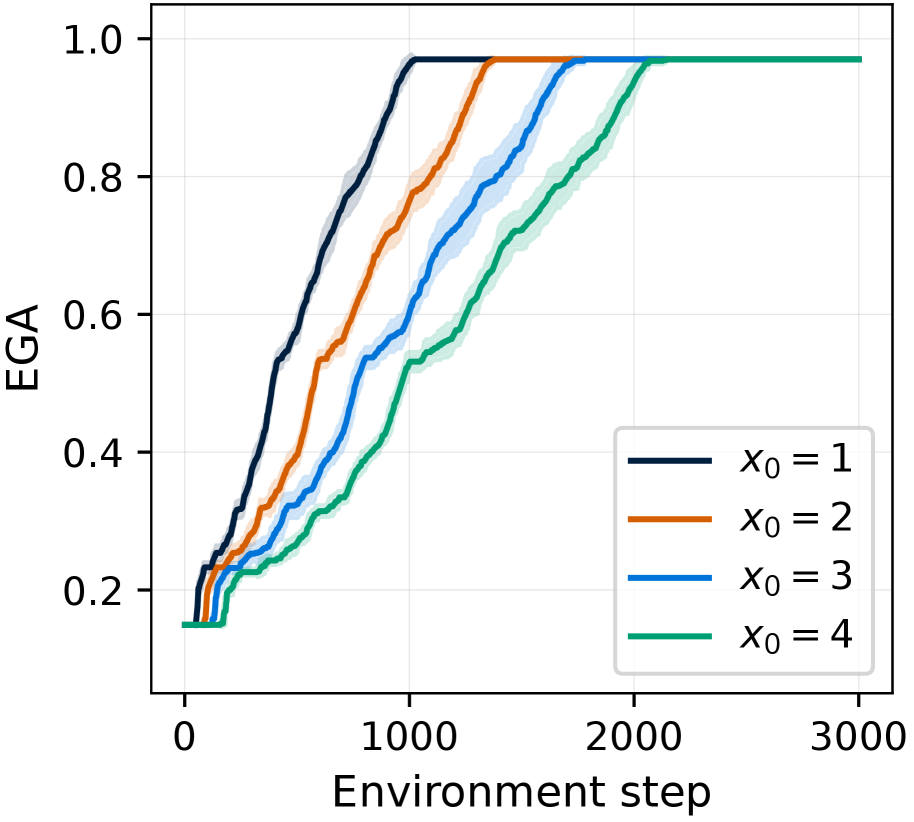
This image presents a line chart illustrating the relationship between EGA (presumably a performance metric) and the Environment Step, for four different initial values of x0. Each line represents the average EGA value over time for a specific x0, with shaded regions indicating the standard deviation around the mean.
### Components/Axes
* **X-axis:** "Environment step" ranging from approximately 0 to 3000.
* **Y-axis:** "EGA" ranging from approximately 0.0 to 1.0.
* **Legend:** Located in the top-right corner, listing the following data series:
* x0 = 1 (Black line)
* x0 = 2 (Gray line)
* x0 = 3 (Orange line)
* x0 = 4 (Blue line)
* **Grid:** A light gray grid is present across the entire chart area, aiding in value estimation.
### Detailed Analysis
The chart displays four lines, each representing a different x0 value. Each line is accompanied by a shaded region representing the standard deviation.
* **x0 = 1 (Black):** The line starts at approximately 0.18 at Environment Step 0, increases steadily, and reaches approximately 0.95 at Environment Step 2000. The shaded region indicates a relatively small standard deviation, especially at higher Environment Steps.
* **x0 = 2 (Gray):** The line begins at approximately 0.18 at Environment Step 0, increases steadily, and reaches approximately 0.98 at Environment Step 2000. The shaded region is slightly larger than that of x0 = 1, indicating more variability.
* **x0 = 3 (Orange):** The line starts at approximately 0.17 at Environment Step 0, increases rapidly, and reaches approximately 1.0 at Environment Step 1200. The shaded region is larger than those of x0 = 1 and x0 = 2, particularly in the initial stages.
* **x0 = 4 (Blue):** The line begins at approximately 0.16 at Environment Step 0, increases steadily, and reaches approximately 0.98 at Environment Step 2000. The shaded region is the largest among the four, indicating the highest variability.
All lines exhibit an upward trend, indicating that EGA generally increases with the Environment Step. The rate of increase varies between the different x0 values.
### Key Observations
* x0 = 3 reaches an EGA of approximately 1.0 the fastest, around Environment Step 1200.
* x0 = 4 has the largest standard deviation, suggesting the most variability in EGA values.
* x0 = 1 and x0 = 2 have similar EGA values and standard deviations.
* All lines converge towards an EGA of approximately 1.0 as the Environment Step increases.
### Interpretation
The data suggests that the initial value of x0 significantly impacts the rate at which EGA increases with the Environment Step. A higher initial value (x0 = 3) leads to faster convergence towards a maximum EGA value. However, a higher initial value (x0 = 4) also introduces more variability in the EGA values.
The convergence of all lines towards EGA = 1.0 indicates that, regardless of the initial x0 value, the system eventually reaches a stable state with a high EGA. The shaded regions represent the uncertainty or variance in the EGA values for each x0, which could be due to random factors or inherent system noise.
The chart demonstrates a trade-off between the speed of convergence and the stability of the system. While a higher initial value can accelerate convergence, it also increases the variability of the results. This information could be valuable for optimizing the initial conditions of the system to achieve a desired balance between performance and reliability.