## Line Chart: EGA Performance Across Environment Steps
### Overview
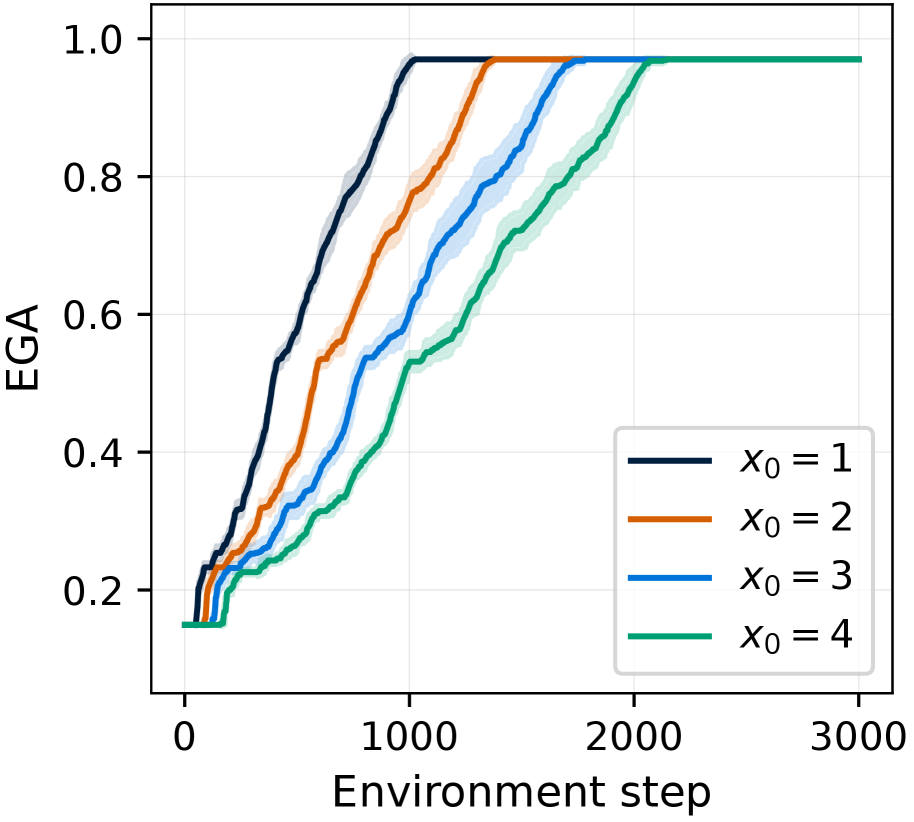
The chart displays four ascending lines representing EGA (Expected Growth Acceleration) performance over environment steps for different initial conditions (x₀ = 1–4). Each line includes a shaded region indicating variability or confidence intervals. All lines converge to EGA = 1.0 by ~2000 environment steps.
### Components/Axes
- **X-axis**: "Environment step" (0–3000, linear scale)
- **Y-axis**: "EGA" (0.2–1.0, linear scale)
- **Legend**: Bottom-right corner, mapping colors to x₀ values:
- Black: x₀ = 1
- Orange: x₀ = 2
- Blue: x₀ = 3
- Green: x₀ = 4
- **Shaded Regions**: ±~0.05–0.10 around each line (approximate uncertainty bounds)
### Detailed Analysis
1. **Line Trends**:
- **x₀ = 1 (Black)**: Steepest initial ascent, reaches EGA = 1.0 by ~1000 steps. Shaded region widest at start (~0.10), narrowing to ~0.02 by end.
- **x₀ = 2 (Orange)**: Slower start than x₀=1, reaches EGA = 1.0 by ~1500 steps. Shaded region narrower (~0.08 at start, ~0.03 at end).
- **x₀ = 3 (Blue)**: Gradual rise, matches x₀=2 by ~2000 steps. Shaded region ~0.06–0.04.
- **x₀ = 4 (Green)**: Slowest start, reaches EGA = 1.0 by ~2500 steps. Shaded region widest (~0.12 at start, ~0.05 at end).
2. **Key Data Points**:
- All lines start near (0, 0.2) and end at (3000, 1.0).
- Lines do not intersect; order remains x₀=1 > x₀=2 > x₀=3 > x₀=4 throughout.
### Key Observations
- **Convergence**: All x₀ values achieve maximum EGA (1.0) by ~2000–2500 steps, regardless of initial condition.
- **Rate of Improvement**: Higher x₀ values show faster acceleration after ~1000 steps, closing the gap with lower x₀.
- **Uncertainty**: Lower x₀ values exhibit greater variability (wider shaded regions), especially early in the environment steps.
### Interpretation
The data suggests that initial conditions (x₀) influence the *rate* of EGA improvement but not the *final outcome*. Higher x₀ values start with lower EGA but accelerate more rapidly, eventually matching the performance of lower x₀. The widening shaded regions for lower x₀ imply greater uncertainty in early-stage measurements, possibly due to smaller sample sizes or higher variability in initial conditions. This pattern could reflect a "catch-up" mechanism where later-stage environmental interactions dominate over initial state dependencies.