\n
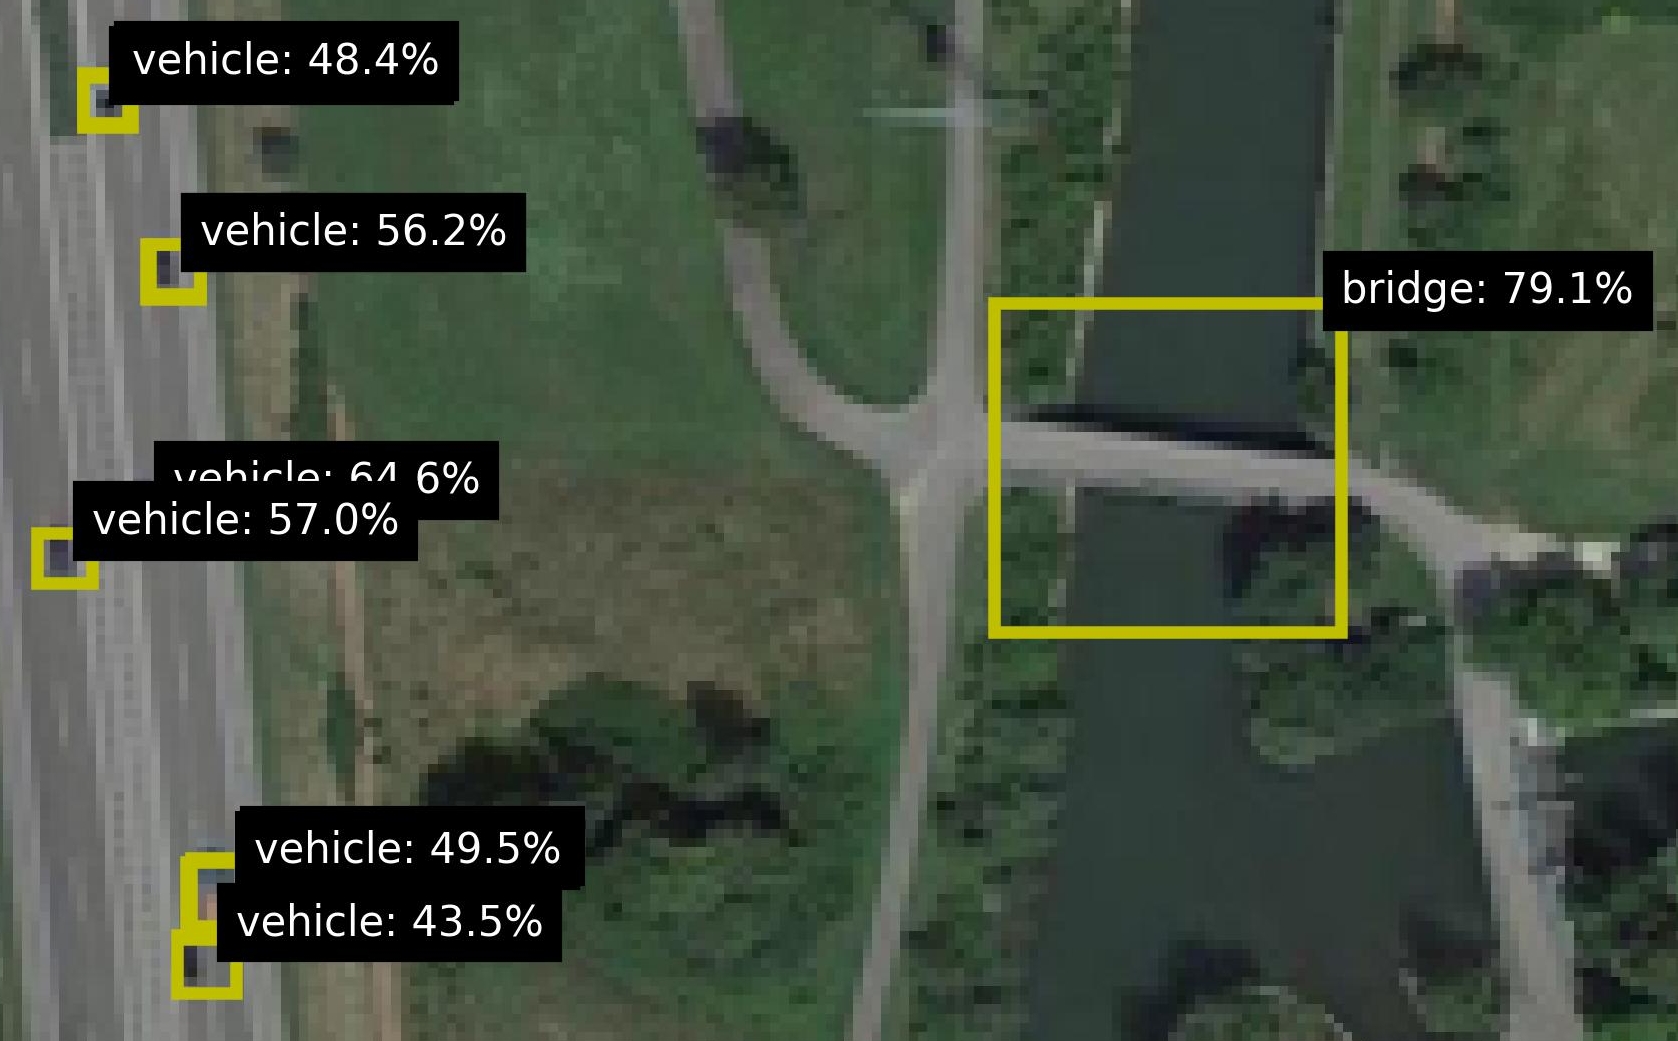
## Object Detection Overlay: Aerial Scene with Vehicle and Bridge Annotations
### Overview
This image is an aerial or satellite photograph of a landscape featuring a road, grassy areas, a water body (likely a river or canal), and a bridge. Overlaid on the photograph are the results of an object detection algorithm, visualized as yellow bounding boxes with accompanying text labels. The labels indicate the detected object class and the model's confidence score for that detection.
### Components/Axes
* **Background Image:** A top-down view of a semi-rural or suburban area.
* **Left Side:** A multi-lane road running vertically.
* **Center/Right Side:** Green, grassy terrain with some trees and pathways.
* **Right Side:** A dark, linear water body running vertically.
* **Center-Right:** A bridge structure crossing the water body, connecting pathways on either side.
* **Annotation Layer:** Yellow rectangular bounding boxes with black text labels positioned adjacent to them.
* **Label Format:** `[object class]: [confidence score]%`
* **Detected Classes:** "vehicle" and "bridge".
* **Confidence Scores:** Percentage values indicating the model's certainty.
### Detailed Analysis
The following object detections are present, listed from top to bottom, left to right:
1. **Top-Left Corner:**
* **Object:** vehicle
* **Confidence:** 48.4%
* **Position:** A small yellow box on the road near the top edge of the image.
2. **Upper-Left Quadrant:**
* **Object:** vehicle
* **Confidence:** 56.2%
* **Position:** A yellow box on the road, below the first detection.
3. **Center-Left (Overlapping Detections):**
* **Detection A:**
* **Object:** vehicle
* **Confidence:** 64.6% (Note: The text is partially obscured but appears to read "64 6%").
* **Position:** A yellow box on the road.
* **Detection B:**
* **Object:** vehicle
* **Confidence:** 57.0%
* **Position:** A yellow box on the road, slightly below and to the left of Detection A. The label for this detection is fully visible.
4. **Bottom-Left Quadrant (Overlapping Detections):**
* **Detection A:**
* **Object:** vehicle
* **Confidence:** 49.5%
* **Position:** A yellow box on the road.
* **Detection B:**
* **Object:** vehicle
* **Confidence:** 43.5%
* **Position:** A yellow box on the road, directly below Detection A.
5. **Center-Right:**
* **Object:** bridge
* **Confidence:** 79.1%
* **Position:** A large yellow box encompassing the bridge structure over the water body. This is the largest and most prominent annotation.
### Key Observations
* **Vehicle Clustering:** All six vehicle detections are clustered on the road on the left side of the image, suggesting a line of traffic or parked cars.
* **Confidence Range:** Vehicle detection confidence scores range from 43.5% to 64.6%, indicating moderate to low certainty by the model. The bridge detection has a significantly higher confidence score of 79.1%.
* **Annotation Layout:** Labels are placed to the right or left of their bounding boxes to avoid obscuring the detected object. Overlapping detections (e.g., at center-left and bottom-left) have their labels stacked vertically.
* **Scene Composition:** The image is divided diagonally by the road (left) and the water/bridge (right), with green space in between.
### Interpretation
This image is a direct output from a computer vision object detection model applied to aerial imagery. The primary purpose is to automatically identify and locate specific objects of interest—in this case, vehicles and infrastructure (a bridge).
* **Data Demonstrated:** The model has successfully localized multiple vehicles on a roadway and a single bridge structure. The confidence scores provide a metric for the reliability of each detection.
* **Element Relationships:** The bounding boxes spatially ground the abstract class labels ("vehicle", "bridge") to specific pixels in the image. The higher confidence for the bridge suggests it is a more distinct or well-defined feature for the model compared to the smaller, potentially less distinct vehicles from this altitude.
* **Notable Anomalies/Patterns:**
* The overlapping vehicle detections at the bottom-left and center-left could indicate either multiple vehicles in close proximity or potential duplicate detections of the same object by the model.
* The absence of detections in the grassy areas or on the pathways suggests the model is either not trained to detect other objects (e.g., trees, pedestrians) or none were present with sufficient confidence.
* The variation in vehicle confidence scores (43.5% to 64.6%) may reflect differences in vehicle size, color contrast against the road, or partial occlusion.
**In summary, this is not a chart or diagram presenting analyzed data trends, but rather a visualization of raw model inference results. The "facts" are the model's predictions: the location and classification of objects with associated confidence metrics. The image serves as a technical record of an object detection algorithm's performance on a specific aerial scene.**