## Diagram: Fallacy Examples and Argument Structures
### Overview
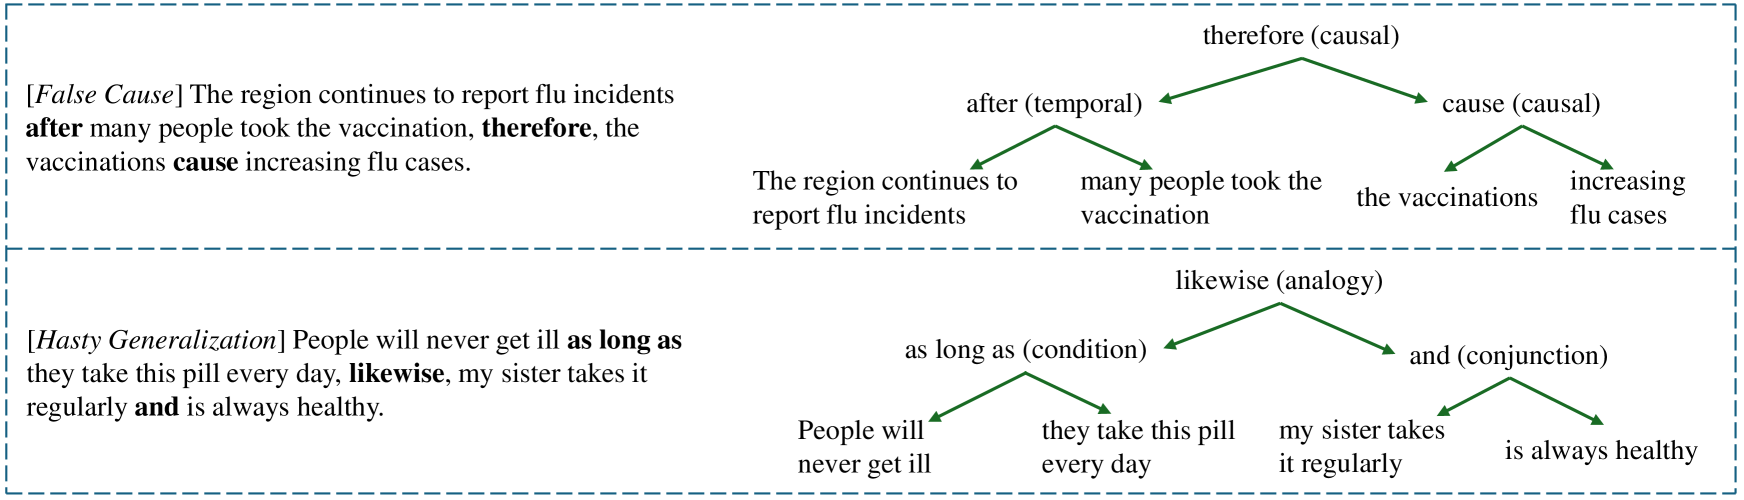
The image presents two examples of logical fallacies, "False Cause" and "Hasty Generalization," each accompanied by a textual description and a tree diagram illustrating the argument's structure. The diagrams break down the sentences into their constituent parts and show the logical relationships between them.
### Components/Axes
* **Fallacy Types:** "False Cause", "Hasty Generalization"
* **Connectives:** "after (temporal)", "therefore (causal)", "as long as (condition)", "likewise (analogy)", "and (conjunction)", "cause (causal)"
* **Textual Descriptions:** Sentences describing the fallacies.
* **Tree Diagrams:** Visual representations of the argument structure.
### Detailed Analysis
**1. False Cause**
* **Text:** "[False Cause] The region continues to report flu incidents after many people took the vaccination, therefore, the vaccinations cause increasing flu cases."
* **Diagram Structure:**
* The top node is "therefore (causal)".
* The left child of "therefore (causal)" is "after (temporal)".
* The right child of "therefore (causal)" is "cause (causal)".
* The left child of "after (temporal)" is "The region continues to report flu incidents".
* The right child of "after (temporal)" is "many people took the vaccination".
* The left child of "cause (causal)" is "the vaccinations".
* The right child of "cause (causal)" is "increasing flu cases".
**2. Hasty Generalization**
* **Text:** "[Hasty Generalization] People will never get ill as long as they take this pill every day, likewise, my sister takes it regularly and is always healthy."
* **Diagram Structure:**
* The top node is "likewise (analogy)".
* The left child of "likewise (analogy)" is "as long as (condition)".
* The right child of "likewise (analogy)" is "and (conjunction)".
* The left child of "as long as (condition)" is "People will never get ill".
* The right child of "as long as (condition)" is "they take this pill every day".
* The left child of "and (conjunction)" is "my sister takes it regularly".
* The right child of "and (conjunction)" is "is always healthy".
### Key Observations
* Each fallacy is presented with a textual example and a corresponding tree diagram.
* The tree diagrams visually represent the logical structure of the arguments, highlighting the relationships between the different parts of the sentences.
* The connectives (e.g., "after," "therefore," "likewise") are labeled with their logical function (e.g., temporal, causal, analogy).
### Interpretation
The image illustrates how logical fallacies can be identified and analyzed by breaking down arguments into their constituent parts. The tree diagrams provide a clear visual representation of the flawed reasoning in each example. The "False Cause" fallacy incorrectly assumes that because one event follows another, the first event caused the second. The "Hasty Generalization" fallacy draws a broad conclusion based on limited evidence (i.e., the sister's health). The diagrams effectively highlight the weak links in these arguments, making it easier to understand why they are fallacious.