\n
## Line Chart: First and Second Thoughts - Correct vs. Incorrect
### Overview
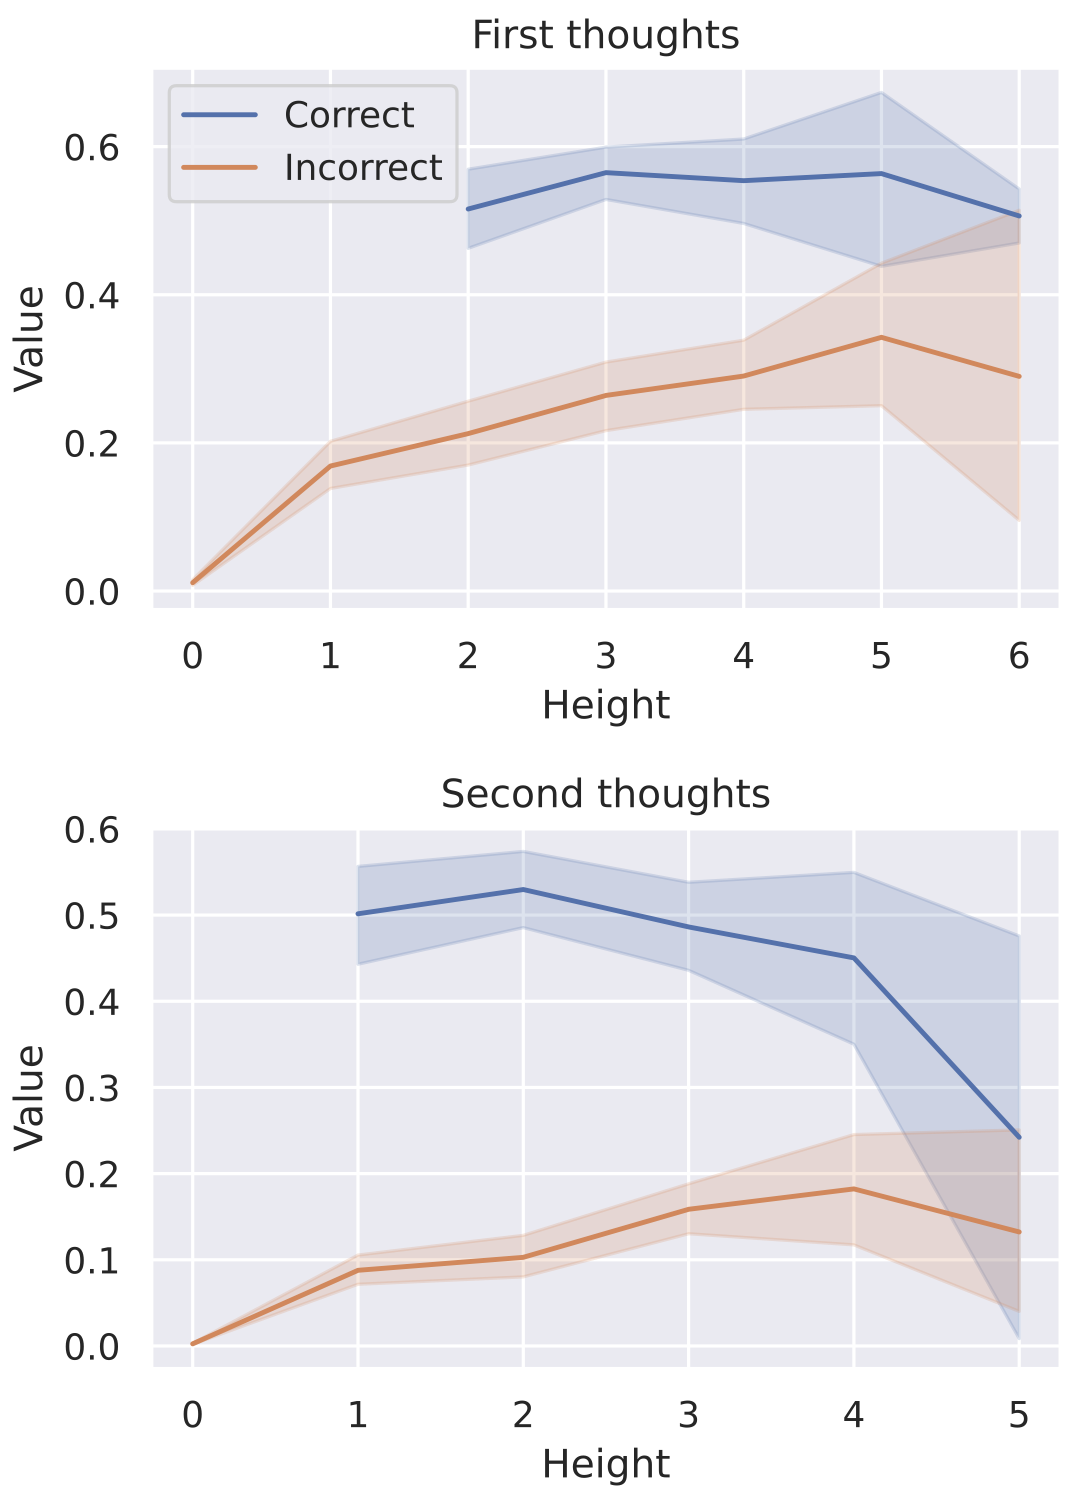
The image presents two line charts, stacked vertically. Both charts depict the relationship between "Height" (on the x-axis) and "Value" (on the y-axis) for two categories: "Correct" and "Incorrect". The charts are titled "First thoughts" and "Second thoughts" respectively. Each line is accompanied by a shaded region representing the confidence interval or standard deviation around the line.
### Components/Axes
* **X-axis:** Labeled "Height", ranging from 0 to 6 in the first chart and 0 to 5 in the second chart.
* **Y-axis:** Labeled "Value", ranging from 0.0 to 0.6 in both charts.
* **Legend (Top-Left of each chart):**
* "Correct" - Represented by a blue line.
* "Incorrect" - Represented by an orange line.
* **Title (Top-Center of each chart):**
* First Chart: "First thoughts"
* Second Chart: "Second thoughts"
### Detailed Analysis or Content Details
**First Thoughts Chart:**
* **Correct (Blue Line):** The line slopes upward from approximately 0.1 at Height 0 to approximately 0.55 at Height 6.
* Height 0: Value ≈ 0.1
* Height 1: Value ≈ 0.25
* Height 2: Value ≈ 0.35
* Height 3: Value ≈ 0.45
* Height 4: Value ≈ 0.5
* Height 5: Value ≈ 0.55
* Height 6: Value ≈ 0.55
* **Incorrect (Orange Line):** The line initially rises slightly from approximately 0.05 at Height 0 to approximately 0.15 at Height 1, then plateaus and declines slightly to approximately 0.1 at Height 6.
* Height 0: Value ≈ 0.05
* Height 1: Value ≈ 0.15
* Height 2: Value ≈ 0.15
* Height 3: Value ≈ 0.12
* Height 4: Value ≈ 0.1
* Height 5: Value ≈ 0.08
* Height 6: Value ≈ 0.1
**Second Thoughts Chart:**
* **Correct (Blue Line):** The line starts at approximately 0.52 at Height 0, remains relatively stable until Height 3 (Value ≈ 0.5), and then declines to approximately 0.35 at Height 5.
* Height 0: Value ≈ 0.52
* Height 1: Value ≈ 0.5
* Height 2: Value ≈ 0.5
* Height 3: Value ≈ 0.5
* Height 4: Value ≈ 0.45
* Height 5: Value ≈ 0.35
* **Incorrect (Orange Line):** The line remains consistently low, starting at approximately 0.05 at Height 0 and increasing slowly to approximately 0.1 at Height 5.
* Height 0: Value ≈ 0.05
* Height 1: Value ≈ 0.07
* Height 2: Value ≈ 0.08
* Height 3: Value ≈ 0.09
* Height 4: Value ≈ 0.1
* Height 5: Value ≈ 0.1
### Key Observations
* In both charts, the "Correct" category consistently has a higher "Value" than the "Incorrect" category.
* In the "First thoughts" chart, the "Correct" value increases with "Height", while the "Incorrect" value remains relatively low.
* In the "Second thoughts" chart, the "Correct" value is initially high but decreases with "Height", while the "Incorrect" value remains consistently low.
* The shaded regions around the lines indicate a degree of uncertainty or variability in the data.
### Interpretation
The charts likely represent the performance or probability of "Correct" versus "Incorrect" responses or outcomes as a function of "Height". "Height" could represent a difficulty level, a feature dimension, or some other relevant variable.
* **"First thoughts"** suggests that as "Height" increases (perhaps indicating increasing difficulty), the probability of a "Correct" response initially increases, but then plateaus. The "Incorrect" responses remain consistently low. This could indicate an initial learning curve or a point where the task becomes saturated.
* **"Second thoughts"** shows a different pattern. The initial probability of a "Correct" response is high, but it decreases as "Height" increases. This could suggest that with further consideration or increased difficulty, people are less confident in their initial "Correct" answers, or that the task becomes more challenging to maintain accuracy. The "Incorrect" responses remain consistently low, suggesting that errors are rare but become more frequent with increasing "Height".
The contrast between the two charts suggests a shift in thinking or a refinement of understanding. The initial positive correlation between "Height" and "Correct" responses is reversed in the "Second thoughts" chart, indicating a more nuanced relationship. The consistent low values for "Incorrect" responses in both charts suggest that the system or individuals being measured are generally reliable, but performance degrades with increasing "Height".