## Line Charts with Confidence Intervals: "First thoughts" and "Second thoughts"
### Overview
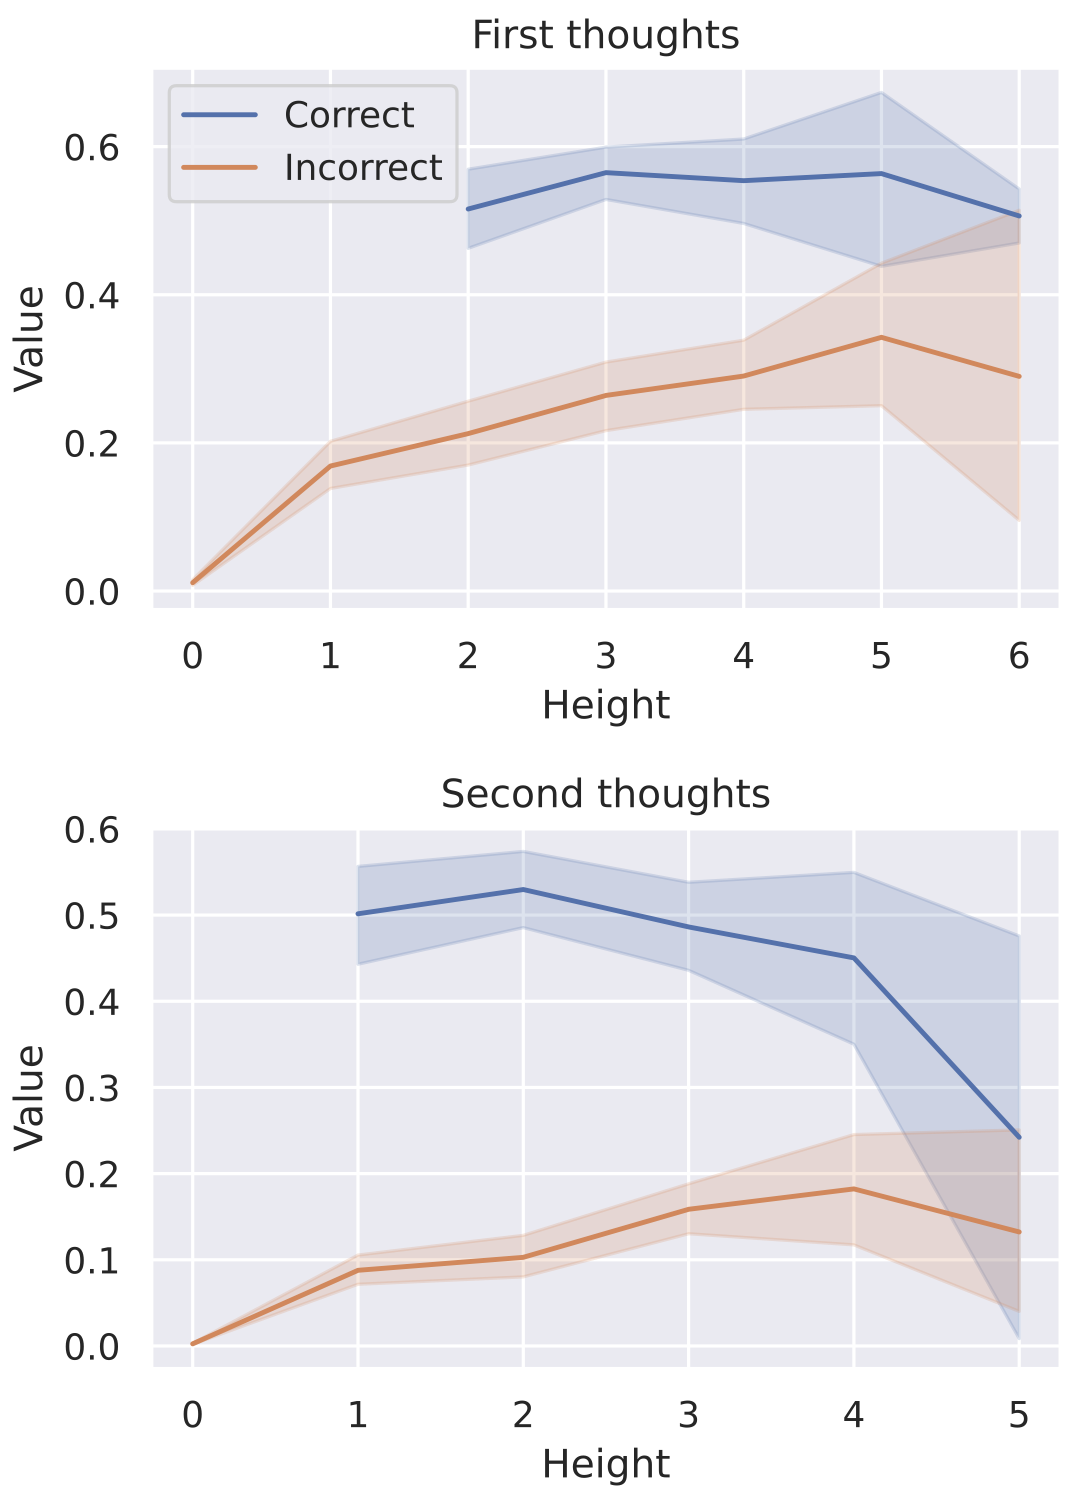
The image contains two vertically stacked line charts, each displaying the relationship between a variable called "Height" (x-axis) and a "Value" (y-axis). Each chart plots two data series, "Correct" and "Incorrect," represented by lines with shaded regions indicating confidence intervals or variability. The charts compare trends between an initial state ("First thoughts") and a subsequent state ("Second thoughts").
### Components/Axes
* **Chart Titles:**
* Top Chart: "First thoughts"
* Bottom Chart: "Second thoughts"
* **Axes:**
* **X-axis (both charts):** Labeled "Height". The scale runs from 0 to 6 in the top chart and 0 to 5 in the bottom chart, with integer tick marks.
* **Y-axis (both charts):** Labeled "Value". The scale runs from 0.0 to 0.6, with tick marks at 0.1 intervals.
* **Legend:**
* **Position:** Top-left corner of the "First thoughts" chart.
* **Series:**
* **Correct:** Represented by a blue line.
* **Incorrect:** Represented by an orange line.
* The same color scheme is used consistently in both charts.
* **Data Representation:**
* Solid lines connect the central tendency (likely mean or median) of each data series at each Height value.
* Shaded bands of corresponding color (light blue for Correct, light orange for Incorrect) surround each line, representing the spread of the data (e.g., standard deviation, standard error, or confidence interval).
### Detailed Analysis
#### **Chart 1: "First thoughts"**
* **Correct Series (Blue Line):**
* **Trend:** The line starts at a high value and remains relatively stable with a slight peak in the middle before a minor decline.
* **Approximate Data Points:**
* Height 2: Value ≈ 0.52
* Height 3: Value ≈ 0.58 (peak)
* Height 4: Value ≈ 0.57
* Height 5: Value ≈ 0.58
* Height 6: Value ≈ 0.51
* **Confidence Interval:** The blue shaded band is moderately wide, suggesting some variability. It is narrowest around Height 3-4 and widens slightly at the extremes (Height 2 and 6).
* **Incorrect Series (Orange Line):**
* **Trend:** The line shows a clear upward trend from Height 0 to 5, followed by a decline at Height 6.
* **Approximate Data Points:**
* Height 0: Value ≈ 0.01
* Height 1: Value ≈ 0.17
* Height 2: Value ≈ 0.21
* Height 3: Value ≈ 0.26
* Height 4: Value ≈ 0.29
* Height 5: Value ≈ 0.35 (peak)
* Height 6: Value ≈ 0.29
* **Confidence Interval:** The orange shaded band is significantly wider than the blue band, especially at higher Height values (4, 5, 6), indicating much greater uncertainty or variance in the "Incorrect" measurements.
#### **Chart 2: "Second thoughts"**
* **Correct Series (Blue Line):**
* **Trend:** The line starts high, peaks early, and then exhibits a pronounced downward trend.
* **Approximate Data Points:**
* Height 1: Value ≈ 0.50
* Height 2: Value ≈ 0.53 (peak)
* Height 3: Value ≈ 0.49
* Height 4: Value ≈ 0.45
* Height 5: Value ≈ 0.25 (sharp drop)
* **Confidence Interval:** The blue shaded band is wide, particularly from Height 3 onward, indicating increasing uncertainty as Height increases and the value drops.
* **Incorrect Series (Orange Line):**
* **Trend:** The line shows a gradual upward trend from Height 0 to 4, followed by a decline at Height 5.
* **Approximate Data Points:**
* Height 0: Value ≈ 0.01
* Height 1: Value ≈ 0.09
* Height 2: Value ≈ 0.10
* Height 3: Value ≈ 0.16
* Height 4: Value ≈ 0.18 (peak)
* Height 5: Value ≈ 0.13
* **Confidence Interval:** The orange shaded band is very wide, especially at Height 4 and 5, where it overlaps substantially with the lower bound of the blue (Correct) band.
### Key Observations
1. **Diverging Trends:** In "First thoughts," the Correct value remains high and stable while the Incorrect value rises. In "Second thoughts," the Correct value declines sharply after an initial peak, while the Incorrect value shows a more modest rise.
2. **Uncertainty Disparity:** Across both charts, the "Incorrect" series (orange) consistently has wider confidence intervals than the "Correct" series (blue), suggesting less reliable or more variable data for incorrect outcomes.
3. **Peak Shift:** The peak for the Correct series occurs at a lower Height in "Second thoughts" (Height 2) compared to "First thoughts" (Height 3/5).
4. **Convergence at High Height:** In both charts, the confidence intervals for Correct and Incorrect begin to overlap at the highest Height values (6 in the first chart, 5 in the second), indicating that the distinction between correct and incorrect values becomes statistically less clear at these extremes.
### Interpretation
The data suggests a cognitive or performance model where "Height" represents a parameter like problem difficulty, time pressure, or cognitive load.
* **"First thoughts"** likely represent an initial, intuitive response. Here, the model maintains high accuracy (Correct value) across increasing difficulty, while the likelihood or magnitude of errors (Incorrect value) also increases. The high uncertainty in errors implies that when initial guesses are wrong, they are highly variable.
* **"Second thoughts"** likely represent a deliberative or review phase. The sharp decline in the Correct value suggests that re-evaluation can undermine initially correct intuitions, especially at higher difficulties. The more modest rise in Incorrect value, coupled with massive uncertainty, indicates that second-guessing often leads to ambiguous or inconsistent outcomes rather than clearly wrong answers.
* **Overall Implication:** The system or subjects perform more reliably and with greater confidence on initial judgments. A secondary review process, particularly under high "Height" conditions, introduces doubt and variability, degrading the clarity and correctness of the outcome. This could model phenomena like overthinking, analysis paralysis, or the interference of System 2 thinking with fast, accurate System 1 intuitions.