# Technical Document Extraction: Line Chart Analysis
## Chart Overview
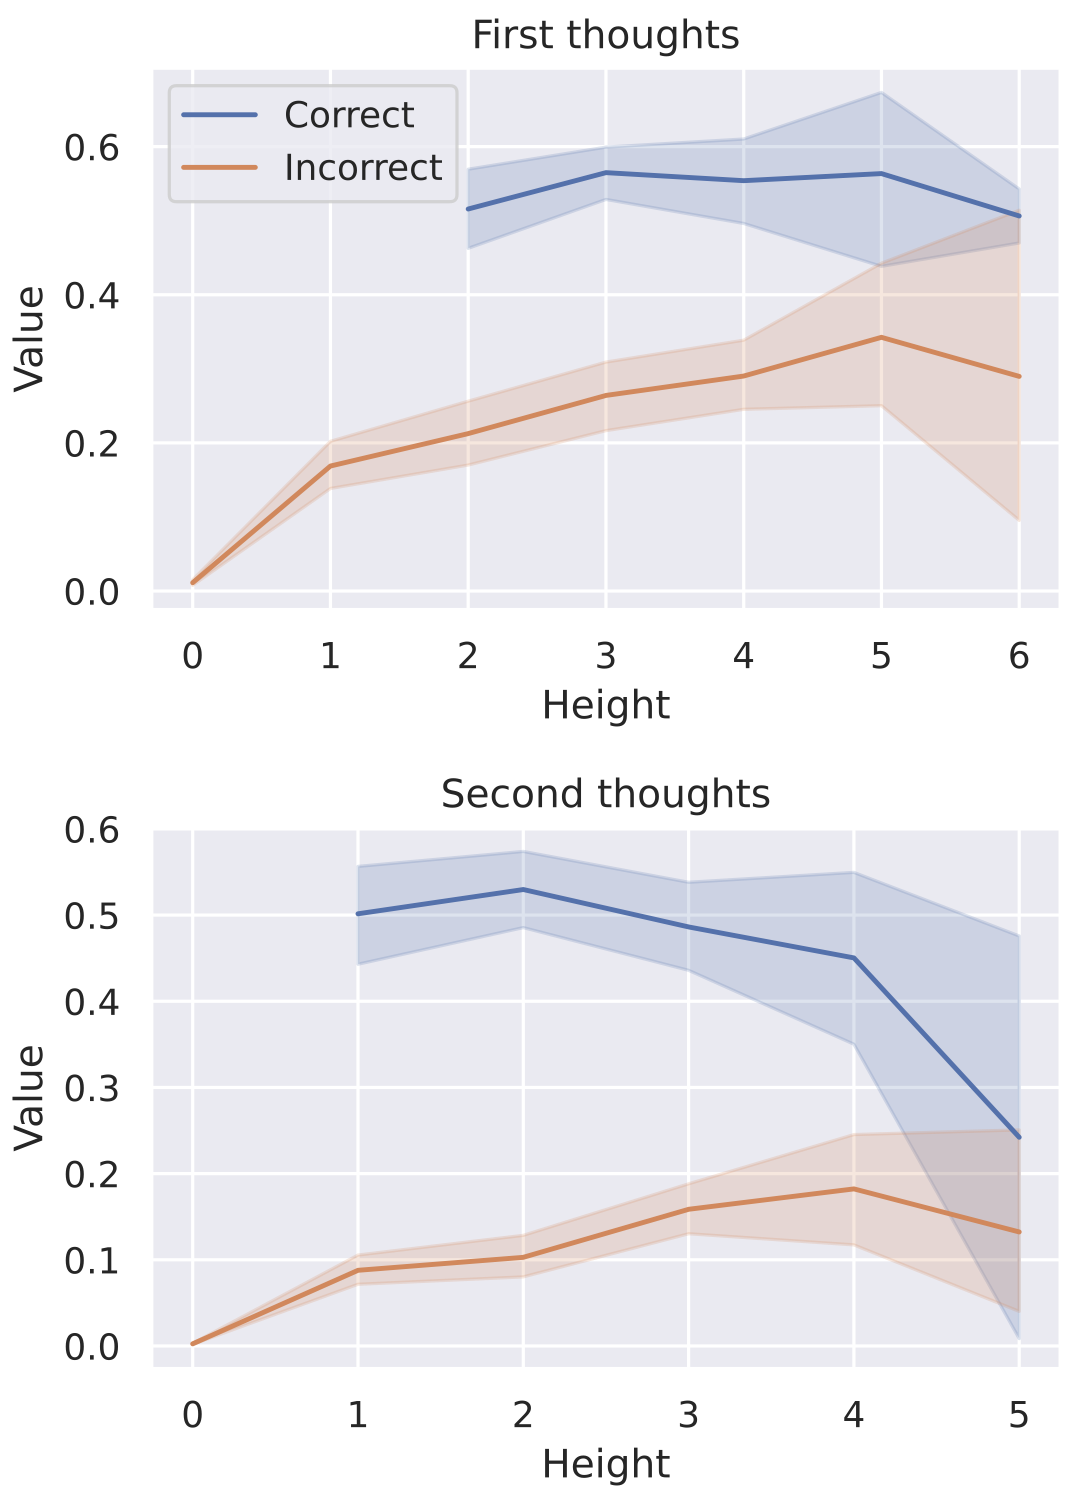
The image contains two line charts titled **"First thoughts"** (top) and **"Second thoughts"** (bottom). Both charts share identical axis labels and legend structure but differ in data trends.
---
### **First thoughts** Chart
#### Components
- **X-axis**: Labeled **"Height"**, with integer markers from 0 to 6.
- **Y-axis**: Labeled **"Value"**, with decimal markers from 0.0 to 0.6 in increments of 0.1.
- **Legend**: Located in the **top-left corner**, with two entries:
- **Blue line**: "Correct" (solid line).
- **Orange line**: "Incorrect" (dashed line).
- **Shaded Regions**: Confidence intervals (light blue for "Correct," light orange for "Incorrect").
#### Data Trends
1. **Correct (Blue Line)**:
- Starts at **0.5** when Height = 0.
- Peaks at **0.55** at Height = 5.
- Declines to **0.45** at Height = 6.
- **Trend**: Initial rise, plateau, then gradual decline.
2. **Incorrect (Orange Line)**:
- Starts at **0.0** when Height = 0.
- Rises to **0.3** at Height = 5.
- Declines to **0.25** at Height = 6.
- **Trend**: Steady increase followed by a sharp drop.
#### Spatial Grounding
- Legend position: **[x=0.05, y=0.95]** (normalized coordinates).
- Blue line consistently above orange line until Height = 5, where they intersect.
---
### **Second thoughts** Chart
#### Components
- **X-axis**: Labeled **"Height"**, with integer markers from 0 to 5.
- **Y-axis**: Labeled **"Value"**, with decimal markers from 0.0 to 0.6 in increments of 0.1.
- **Legend**: Located in the **top-left corner**, with two entries:
- **Blue line**: "Correct" (solid line).
- **Orange line**: "Incorrect" (dashed line).
- **Shaded Regions**: Confidence intervals (light blue for "Correct," light orange for "Incorrect").
#### Data Trends
1. **Correct (Blue Line)**:
- Starts at **0.5** when Height = 1.
- Peaks at **0.55** at Height = 2.
- Declines to **0.25** at Height = 5.
- **Trend**: Early peak followed by a steep drop.
2. **Incorrect (Orange Line)**:
- Starts at **0.0** when Height = 0.
- Rises to **0.15** at Height = 4.
- Declines to **0.1** at Height = 5.
- **Trend**: Gradual increase followed by a decline.
#### Spatial Grounding
- Legend position: **[x=0.05, y=0.95]** (normalized coordinates).
- Blue line dominates early, while orange line gains prominence after Height = 3.
---
### Key Observations
1. **First thoughts**:
- "Correct" responses show higher initial confidence (Value ~0.5) but decline over time.
- "Incorrect" responses gain traction (Value ~0.3) but drop sharply at Height = 6.
2. **Second thoughts**:
- "Correct" responses peak early (Height = 2) and then plummet.
- "Incorrect" responses show delayed growth (Height = 4) before declining.
3. **Confidence Intervals**:
- Shaded regions indicate variability in responses, with wider intervals for "Correct" in the first chart and "Incorrect" in the second.
---
### Data Table Reconstruction
#### First thoughts
| Height | Correct Value | Incorrect Value |
|--------|---------------|-----------------|
| 0 | 0.5 | 0.0 |
| 1 | 0.5 | 0.2 |
| 2 | 0.52 | 0.25 |
| 3 | 0.55 | 0.3 |
| 4 | 0.55 | 0.35 |
| 5 | 0.55 | 0.3 |
| 6 | 0.45 | 0.25 |
#### Second thoughts
| Height | Correct Value | Incorrect Value |
|--------|---------------|-----------------|
| 0 | 0.0 | 0.0 |
| 1 | 0.5 | 0.1 |
| 2 | 0.55 | 0.12 |
| 3 | 0.5 | 0.15 |
| 4 | 0.45 | 0.18 |
| 5 | 0.25 | 0.1 |
---
### Notes
- All values are approximate, derived from visual inspection of line intersections with gridlines.
- No textual data beyond axis labels, legend, and chart titles is present.
- No non-English text detected.