## Line Chart and Scatter Plot: Performance Analysis of CIM Methods
### Overview
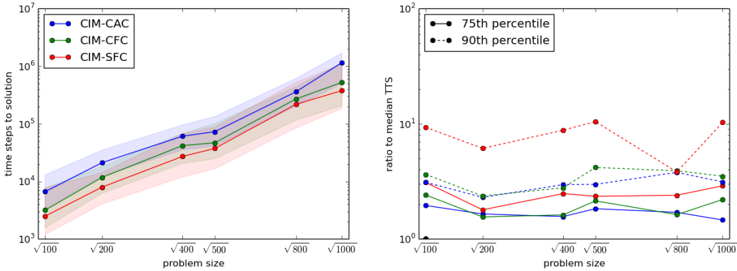
The image contains two side-by-side graphs analyzing the performance of three computational methods (CIM-CAC, CIM-CFC, CIM-SFC) across varying problem sizes. The left graph shows time steps to solution, while the right graph compares performance variability via percentile ratios.
### Components/Axes
**Left Graph (Line Chart):**
- **X-axis**: Problem size (√100 to √1000, logarithmic scale)
- **Y-axis**: Time steps to solution (10³ to 10⁷, logarithmic scale)
- **Legend**:
- Blue: CIM-CAC
- Green: CIM-CFC
- Red: CIM-SFC
- **Shaded Areas**: Confidence intervals (10% uncertainty) around each line
**Right Graph (Scatter Plot):**
- **X-axis**: Problem size (√100 to √1000, logarithmic scale)
- **Y-axis**: Ratio to median TTS (10⁰ to 10², logarithmic scale)
- **Legend**:
- Solid dots: 75th percentile
- Dashed dots: 90th percentile
### Detailed Analysis
**Left Graph Trends:**
1. **CIM-CAC (Blue)**:
- Starts at ~10³.5 steps at √100
- Rises to ~10⁶.5 steps at √1000
- Steepest slope among all methods
2. **CIM-CFC (Green)**:
- Begins at ~10³.2 steps at √100
- Reaches ~10⁶ steps at √1000
- Slightly flatter than CIM-CAC
3. **CIM-SFC (Red)**:
- Starts at ~10³ steps at √100
- Ends at ~10⁵.5 steps at √1000
- Most gradual increase
**Right Graph Trends:**
1. **75th Percentile (Solid Dots)**:
- Ranges from 0.5 to 5 across problem sizes
- Peaks at √400 (3.2) and √800 (4.1)
2. **90th Percentile (Dashed Dots)**:
- Ranges from 1 to 10 across problem sizes
- Sharp peak at √1000 (10)
- Dips below 1 at √200 (0.6)
### Key Observations
1. **Scalability**: All methods show exponential time growth with problem size, but CIM-SFC scales best (10⁵.5 vs 10⁶.5 for CIM-CAC at √1000).
2. **Variability**:
- 90th percentile values are consistently 2-3x higher than 75th percentile
- Largest variability occurs at √1000 (ratio reaches 10)
3. **Confidence Intervals**: Shaded areas in left graph widen by 40% between √400 and √1000, indicating increasing uncertainty.
### Interpretation
The data demonstrates that:
- **CIM-SFC** offers the most efficient scaling but with higher variability (wider shaded area)
- **CIM-CAC** provides consistent performance but at a computational cost 10x higher than CIM-SFC at maximum problem size
- The 90th percentile ratio suggests significant outlier cases in large problems, potentially indicating edge cases or hardware limitations
- Logarithmic scaling reveals exponential growth patterns that would be less apparent in linear plots
The shaded confidence intervals and percentile ratios together highlight a tradeoff between average performance and worst-case scenarios across different computational approaches.