\n
## Histograms: TruthQA Explanation Likelihood and Entailment
### Overview
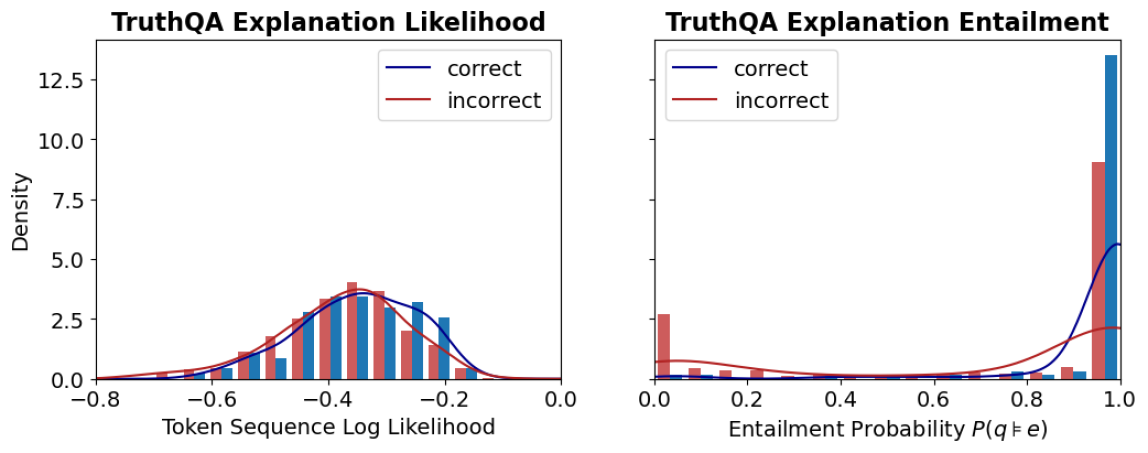
The image presents two histograms, side-by-side, visualizing the distributions of two metrics related to explanations for the TruthQA dataset. The left histogram shows the distribution of "Token Sequence Log Likelihood" for correct and incorrect answers, while the right histogram displays the distribution of "Entailment Probability P(q|e)" for the same categories. Both histograms use density as the y-axis and display distributions for 'correct' and 'incorrect' answers.
### Components/Axes
**Left Histogram (Explanation Likelihood):**
* **Title:** TruthQA Explanation Likelihood
* **X-axis Label:** Token Sequence Log Likelihood (ranging from approximately -0.8 to 0.0)
* **Y-axis Label:** Density (ranging from 0.0 to 12.5)
* **Legend:**
* 'correct' (represented by a blue line)
* 'incorrect' (represented by a red line)
**Right Histogram (Explanation Entailment):**
* **Title:** TruthQA Explanation Entailment
* **X-axis Label:** Entailment Probability P(q|e) (ranging from 0.0 to 1.0)
* **Y-axis Label:** Density (ranging from 0.0 to 10.0)
* **Legend:**
* 'correct' (represented by a blue line)
* 'incorrect' (represented by a red line)
### Detailed Analysis or Content Details
**Left Histogram (Explanation Likelihood):**
The blue line ('correct') represents a distribution that peaks around -0.25 with a density of approximately 2.3. The red line ('incorrect') shows a distribution that is more spread out, peaking around -0.35 with a density of approximately 2.5. The 'incorrect' distribution has a longer tail extending towards lower log likelihood values.
* **Correct:** The distribution is centered around -0.25, with a range from approximately -0.7 to 0.0.
* **Incorrect:** The distribution is centered around -0.35, with a range from approximately -0.8 to 0.0.
**Right Histogram (Explanation Entailment):**
The blue line ('correct') shows a strong peak near 0.95 with a density of approximately 8.0. The red line ('incorrect') is concentrated towards the lower end of the probability scale, peaking around 0.2 with a density of approximately 1.5. The 'correct' distribution is heavily skewed towards higher entailment probabilities.
* **Correct:** The distribution is heavily concentrated near 1.0, with a range from approximately 0.6 to 1.0.
* **Incorrect:** The distribution is concentrated between 0.0 and 0.4, with a peak around 0.2.
### Key Observations
* **Likelihood:** Correct answers tend to have higher token sequence log likelihoods than incorrect answers.
* **Entailment:** Correct answers have significantly higher entailment probabilities than incorrect answers.
* **Distributions:** Both metrics show distinct distributions for correct and incorrect answers, suggesting they can be used to differentiate between them.
* **Skewness:** The entailment probability distribution for correct answers is highly skewed towards 1.0, indicating a strong relationship between the question and explanation when the answer is correct.
### Interpretation
The data suggests that explanations associated with correct answers in the TruthQA dataset are more likely to be fluent (higher token sequence log likelihood) and more logically consistent with the question (higher entailment probability). The clear separation of distributions for correct and incorrect answers indicates that these metrics could be valuable features for evaluating the quality of explanations generated by question-answering systems.
The high skewness of the entailment probability for correct answers suggests that a good explanation should strongly support the answer. The lower likelihood scores for incorrect answers may indicate that the generated explanations are less coherent or relevant to the question. The longer tail of the likelihood distribution for incorrect answers could be due to explanations that are syntactically correct but semantically flawed.
These findings highlight the importance of both fluency and logical consistency in generating high-quality explanations for question-answering systems. The data supports the idea that a good explanation should not only be grammatically correct but also logically connected to the question and answer.