## Chart/Diagram Type: Dual Histogram with Overlaid Density Curves
### Overview
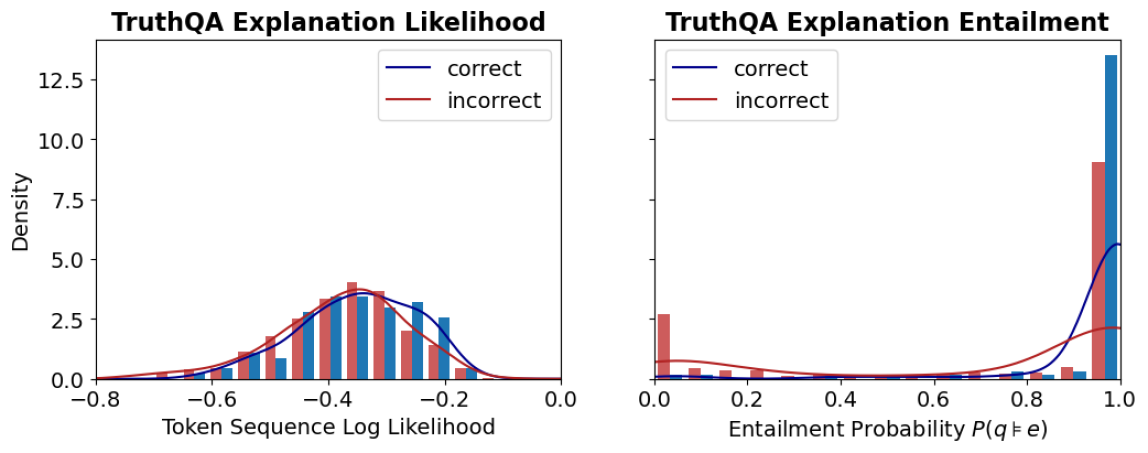
The image contains two side-by-side visualizations comparing the distribution of **Token Sequence Log Likelihood** (left) and **Entailment Probability P(q≠e)** (right) for **correct** and **incorrect** TruthQA explanations. Both charts use density curves (blue for correct, red for incorrect) overlaid on histograms (blue and red bars).
### Components/Axes
#### Left Chart: TruthQA Explanation Likelihood
- **X-axis**: Token Sequence Log Likelihood (range: -0.8 to 0.0)
- **Y-axis**: Density (range: 0.0 to 12.5)
- **Legend**:
- Blue line: Correct explanations
- Red line: Incorrect explanations
- **Bars**: Blue (correct) and red (incorrect) histograms.
#### Right Chart: TruthQA Explanation Entailment
- **X-axis**: Entailment Probability P(q≠e) (range: 0.0 to 1.0)
- **Y-axis**: Density (range: 0.0 to 12.5)
- **Legend**:
- Blue line: Correct explanations
- Red line: Incorrect explanations
- **Bars**: Single blue bar at 1.0 (correct) and single red bar at 0.9 (incorrect).
### Detailed Analysis
#### Left Chart: Token Sequence Log Likelihood
- **Distribution**:
- Correct explanations (blue) peak around **-0.4** with a density of ~4.0.
- Incorrect explanations (red) peak slightly lower at **-0.45** with a density of ~3.5.
- Both distributions taper off toward the edges of the x-axis.
- **Trends**:
- Correct explanations show a broader spread (wider histogram bars) compared to incorrect ones.
- The blue density curve aligns closely with the histogram peaks, confirming higher likelihoods for correct explanations.
#### Right Chart: Entailment Probability P(q≠e)
- **Distribution**:
- Correct explanations (blue) have a sharp peak at **1.0** with a density of ~12.5.
- Incorrect explanations (red) have a single bar at **0.9** with a density of ~9.0.
- **Trends**:
- Correct explanations dominate the high-entailment region (near 1.0), while incorrect ones cluster near 0.9.
- The blue density curve rises sharply at 1.0, indicating near-certainty for correct entailments.
### Key Observations
1. **Likelihood vs. Entailment**:
- Correct explanations exhibit higher token sequence log likelihoods (left chart) and near-perfect entailment probabilities (right chart).
- Incorrect explanations cluster at lower likelihoods and slightly lower entailment probabilities.
2. **Confidence in Correctness**:
- The sharp peak at 1.0 for correct entailment suggests the model is highly confident in correct answers.
- Incorrect explanations show minimal deviation from 0.9, indicating lower confidence.
3. **Distribution Variability**:
- Correct explanations have a wider distribution in log likelihoods, suggesting variability in how correct answers are generated.
- Incorrect explanations are more tightly clustered, implying consistency in errors.
### Interpretation
- **Model Behavior**:
- The data suggests the model generates correct explanations with higher linguistic likelihood and stronger entailment, aligning with expected correctness.
- Incorrect explanations are less probable in both metrics, but their near-1.0 entailment probability (red bar at 0.9) raises questions about edge cases where errors are plausible but incorrect.
- **Implications**:
- The model’s confidence in correct answers is robust, as evidenced by the 1.0 entailment peak.
- The slight gap between correct (1.0) and incorrect (0.9) entailment probabilities highlights the model’s ability to distinguish near-correct answers.
- **Anomalies**:
- The red bar at 0.9 in the right chart is unusually high for incorrect explanations, suggesting some errors may mimic correct answers closely. Further investigation into these cases could reveal model weaknesses.