## Line Chart: Math 500 Extractive Matchover Iterations per Model (with Variance)
### Overview
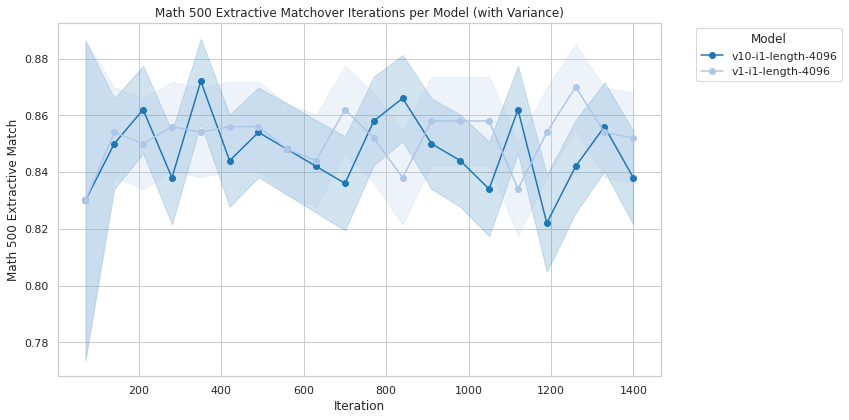
This image displays a line chart comparing the performance of two distinct models—"v10-i1-length-4096" and "v1-i1-length-4096"—on a "Math 500 Extractive Match" task. The chart tracks performance metrics across a series of training iterations, with shaded regions surrounding each line representing the variance (uncertainty) for each data point.
### Components/Axes
* **Header:** "Math 500 Extractive Matchover Iterations per Model (with Variance)"
* **X-Axis:** Labeled "Iteration". The scale ranges from approximately 100 to 1400, with major grid lines marked at 200, 400, 600, 800, 1000, 1200, and 1400.
* **Y-Axis:** Labeled "Math 500 Extractive Match". The scale ranges from 0.78 to 0.88, with major grid lines marked at 0.78, 0.80, 0.82, 0.84, 0.86, and 0.88.
* **Legend:** Located in the top-right corner.
* **v10-i1-length-4096:** Represented by a dark blue line with circular markers and a dark blue shaded variance region.
* **v1-i1-length-4096:** Represented by a light blue line with circular markers and a light blue shaded variance region.
### Detailed Analysis
#### Trend Verification
* **v10-i1-length-4096 (Dark Blue):** This series exhibits high volatility. It begins with a sharp upward trend, followed by significant fluctuations throughout the iteration range. It shows a notable peak around iteration 350 and a sharp, significant drop at iteration 1200.
* **v1-i1-length-4096 (Light Blue):** This series exhibits a more consistent, gradual upward trend. It is generally smoother than the dark blue series, with fewer sharp fluctuations.
#### Data Points (Approximate Values)
* **Starting Point (Iteration ~100):** Both models begin at approximately 0.83. The dark blue model (v10) has a much wider variance (shaded region) at this point, extending from ~0.77 to ~0.89.
* **Mid-Range (Iteration ~700):**
* The light blue model (v1) reaches a local peak of approximately 0.86.
* The dark blue model (v10) dips to approximately 0.835.
* **Late-Range (Iteration ~1200):**
* The light blue model (v1) reaches a high point of approximately 0.87.
* The dark blue model (v10) experiences a sharp decline to approximately 0.82.
* **Ending Point (Iteration ~1400):**
* The light blue model (v1) settles at approximately 0.85.
* The dark blue model (v10) recovers slightly to approximately 0.84.
### Key Observations
* **Variance:** Both models show the highest variance at the initial iteration (100). As iterations progress, the variance for both models generally tightens, though the dark blue model (v10) maintains wider fluctuations in its performance compared to the light blue model (v1).
* **Performance Divergence:** After iteration 600, the light blue model (v1) consistently maintains a more stable performance profile, whereas the dark blue model (v10) exhibits erratic behavior, characterized by sharp peaks and valleys.
* **Outlier:** The most significant anomaly is the sharp drop in the dark blue model (v10) at iteration 1200, which deviates significantly from its previous trend.
### Interpretation
The data suggests that the "v1-i1-length-4096" model is more robust and reliable for this specific task than the "v10-i1-length-4096" model. While both models start with similar performance, the "v1" model demonstrates a more stable learning curve and higher peak performance in the latter half of the training process. The "v10" model's erratic behavior, particularly the sharp decline at iteration 1200, indicates potential instability in its training process or sensitivity to the specific data batches encountered at that stage. The wider variance in the "v10" model further supports the conclusion that it is less predictable than the "v1" model.