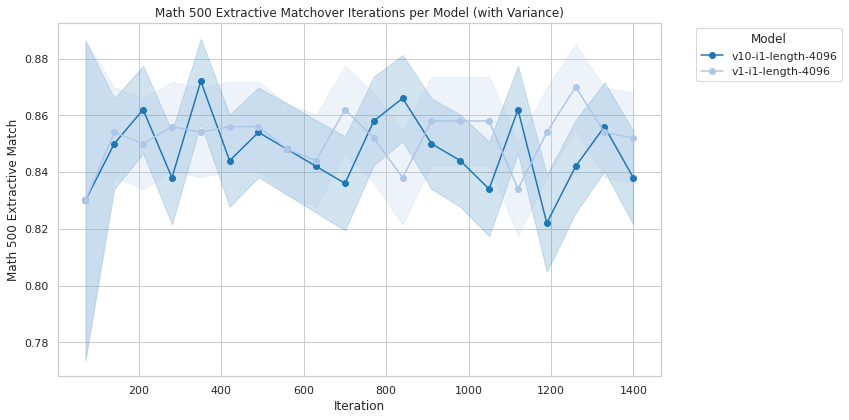
## Line Chart: Math 500 Extractive Matchover Iterations per Model (with Variance)
### Overview
The image is a line chart comparing the performance of two models, "v10-il-length-4096" and "v1-il-length-4096", based on their "Math 500 Extractive Match" scores over iterations. The chart also displays the variance for each model.
### Components/Axes
* **Title:** Math 500 Extractive Matchover Iterations per Model (with Variance)
* **X-axis:**
* Label: Iteration
* Scale: 0 to 1400, with markers at 200, 400, 600, 800, 1000, 1200, and 1400.
* **Y-axis:**
* Label: Math 500 Extractive Match
* Scale: 0.78 to 0.88, with markers at 0.78, 0.80, 0.82, 0.84, 0.86, and 0.88.
* **Legend:** Located at the top-right of the chart.
* Model:
* v10-il-length-4096 (Dark Blue line with circle markers)
* v1-il-length-4096 (Light Blue line with circle markers)
### Detailed Analysis
* **v10-il-length-4096 (Dark Blue):**
* Trend: The line fluctuates significantly over the iterations.
* Data Points (Approximate):
* Iteration 100: 0.85
* Iteration 200: 0.86
* Iteration 300: 0.84
* Iteration 400: 0.85
* Iteration 500: 0.84
* Iteration 600: 0.835
* Iteration 700: 0.86
* Iteration 800: 0.87
* Iteration 900: 0.85
* Iteration 1000: 0.84
* Iteration 1100: 0.835
* Iteration 1200: 0.82
* Iteration 1300: 0.84
* Iteration 1400: 0.84
* **v1-il-length-4096 (Light Blue):**
* Trend: The line remains relatively stable over the iterations.
* Data Points (Approximate):
* Iteration 100: 0.83
* Iteration 200: 0.85
* Iteration 300: 0.855
* Iteration 400: 0.86
* Iteration 500: 0.855
* Iteration 600: 0.85
* Iteration 700: 0.86
* Iteration 800: 0.86
* Iteration 900: 0.86
* Iteration 1000: 0.86
* Iteration 1100: 0.86
* Iteration 1200: 0.86
* Iteration 1300: 0.855
* Iteration 1400: 0.855
* **Variance:** The shaded areas around each line represent the variance. The variance for "v10-il-length-4096" appears to be larger than that of "v1-il-length-4096".
### Key Observations
* The "v10-il-length-4096" model exhibits more fluctuation in its performance compared to the "v1-il-length-4096" model.
* The "v1-il-length-4096" model maintains a relatively consistent performance throughout the iterations.
* The variance is higher for "v10-il-length-4096" than "v1-il-length-4096".
### Interpretation
The chart suggests that the "v1-il-length-4096" model is more stable and consistent in its performance on the "Math 500 Extractive Match" task compared to the "v10-il-length-4096" model. While "v10-il-length-4096" shows some peaks in performance, it also experiences more significant drops, leading to higher variance. This information could be valuable in deciding which model to use, depending on the desired balance between potential peak performance and consistent reliability.