\n
## Line Chart: Math 500 Extractive Matchover Iterations per Model (with Variance)
### Overview
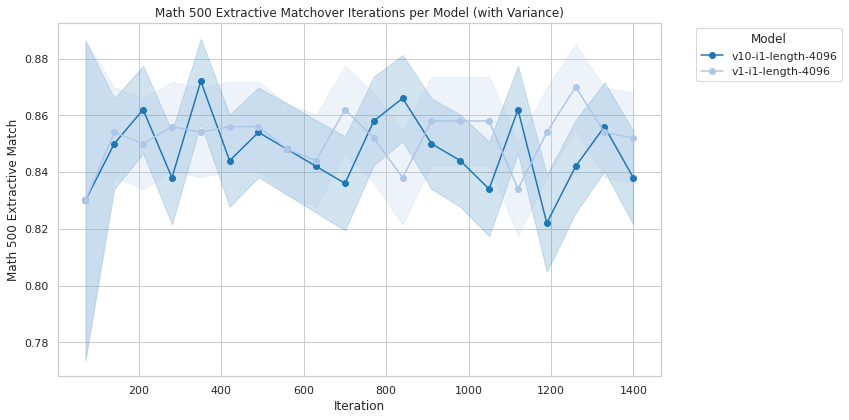
This line chart displays the Math 500 Extractive Match score over iterations for two different models: `v10-i1-length-4096` and `v1-i1-length-4096`. The chart also shows the variance around each line, represented by shaded regions. The x-axis represents the iteration number, and the y-axis represents the Math 500 Extractive Match score.
### Components/Axes
* **Title:** Math 500 Extractive Matchover Iterations per Model (with Variance) - positioned at the top-center.
* **X-axis Label:** Iteration - positioned at the bottom-center. Scale ranges from approximately 0 to 1400, with gridlines at 200-iteration intervals.
* **Y-axis Label:** Math 500 Extractive Match - positioned at the left-center. Scale ranges from approximately 0.78 to 0.88, with gridlines at 0.02 intervals.
* **Legend:** Located in the top-right corner.
* `v10-i1-length-4096` - represented by a dark blue line with circular markers.
* `v1-i1-length-4096` - represented by a light blue line with circular markers.
### Detailed Analysis
**Model v10-i1-length-4096 (Dark Blue Line):**
The line generally trends upward initially, then fluctuates with some peaks and valleys.
* Iteration 0: Approximately 0.825
* Iteration 200: Approximately 0.855
* Iteration 400: Approximately 0.84
* Iteration 600: Approximately 0.845
* Iteration 800: Approximately 0.86
* Iteration 1000: Approximately 0.83
* Iteration 1200: Approximately 0.85
* Iteration 1400: Approximately 0.855
**Model v1-i1-length-4096 (Light Blue Line):**
This line also shows fluctuations, with a similar overall trend.
* Iteration 0: Approximately 0.845
* Iteration 200: Approximately 0.855
* Iteration 400: Approximately 0.85
* Iteration 600: Approximately 0.84
* Iteration 800: Approximately 0.855
* Iteration 1000: Approximately 0.825
* Iteration 1200: Approximately 0.845
* Iteration 1400: Approximately 0.86
**Variance (Shaded Regions):**
Both models have significant variance, indicated by the large shaded areas around the lines. The variance appears to be relatively consistent across iterations, with no obvious patterns of increasing or decreasing uncertainty.
### Key Observations
* Both models exhibit similar performance, with Math 500 Extractive Match scores fluctuating between approximately 0.82 and 0.87.
* The variance is substantial for both models, suggesting that the results are not highly consistent.
* There isn't a clear winner between the two models; they trade places in terms of performance throughout the iterations.
* The lines are relatively close together, indicating that the difference in performance between the two models is not dramatic.
### Interpretation
The chart suggests that both models are performing reasonably well on the Math 500 Extractive Match task, but their performance is somewhat unstable. The large variance indicates that the results are sensitive to factors not explicitly controlled in the experiment. The lack of a clear performance difference between the two models suggests that the specific configuration differences (v10 vs. v1) do not have a substantial impact on the outcome, at least within the range of iterations shown. Further investigation might be needed to understand the sources of variance and to determine whether one model consistently outperforms the other over a longer period or with different data. The initial upward trend for both models could indicate a learning or adaptation phase, but the subsequent fluctuations suggest that the models may have reached a plateau or are experiencing some form of instability.