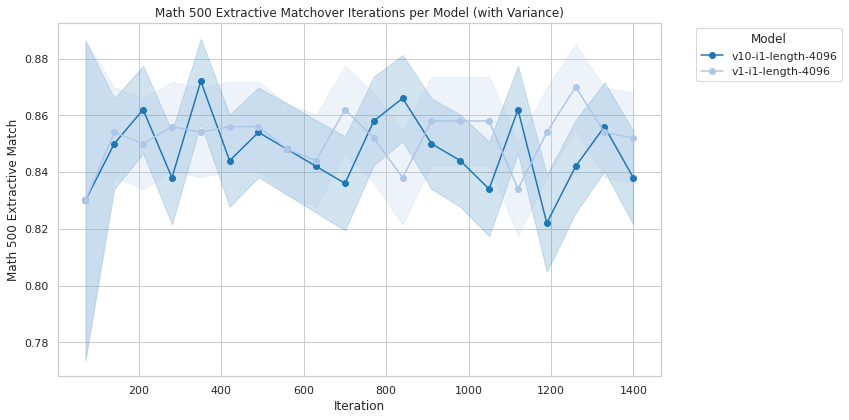
## Line Chart: Math 500 Extractive Matchover Iterations per Model (with Variance)
### Overview
The chart compares the performance of two models (`v10-i1-length-4096` and `v11-i1-length-4096`) across 1400 iterations of a "Math 500 Extractive Match" metric. Both models exhibit fluctuating performance with shaded regions representing variance. The y-axis ranges from 0.78 to 0.88, while the x-axis spans 0 to 1400 iterations.
### Components/Axes
- **X-axis (Iteration)**: Labeled "Iteration" with ticks at 200, 400, 600, 800, 1000, 1200, and 1400.
- **Y-axis (Math 500 Extractive Match)**: Labeled "Math 500 Extractive Match" with ticks at 0.78, 0.80, 0.82, 0.84, 0.86, and 0.88.
- **Legend**: Located in the top-right corner, associating:
- **Dark blue line**: `v10-i1-length-4096`
- **Light blue line**: `v11-i1-length-4096`
- **Shaded Regions**: Represent variance around each model's performance line.
### Detailed Analysis
1. **Model `v10-i1-length-4096` (Dark Blue)**:
- Starts at ~0.83 (iteration 0) with a sharp dip to ~0.78 at iteration 100.
- Peaks at ~0.87 (iteration 400), then fluctuates between ~0.84 and ~0.86.
- Ends at ~0.84 (iteration 1400).
- Variance band widest at iteration 400 (~0.82–0.88).
2. **Model `v11-i1-length-4096` (Light Blue)**:
- Starts at ~0.82 (iteration 0) with a gradual rise to ~0.86 (iteration 800).
- Peaks at ~0.87 (iteration 1200), then declines to ~0.85 (iteration 1400).
- Variance band narrowest at iteration 0 (~0.81–0.83).
### Key Observations
- **Initial Performance**: `v10` begins stronger (~0.83 vs. ~0.82 for `v11`), but `v11` stabilizes faster.
- **Peaks**: Both models reach ~0.87, but `v10` peaks earlier (iteration 400) while `v11` peaks later (iteration 1200).
- **Variance**: `v10` exhibits higher variability (wider shaded regions), especially at iteration 400.
- **Final Performance**: `v11` ends slightly higher (~0.85 vs. ~0.84 for `v10`).
### Interpretation
The data suggests that `v10` initially outperforms `v11` but suffers from greater instability, as evidenced by its wider variance band. `v11` demonstrates more consistent improvement over time, surpassing `v10` in later iterations. The peaks at ~0.87 for both models may indicate optimal performance thresholds, though `v10` achieves this earlier. The final divergence (~0.85 vs. ~0.84) implies `v11` is more robust for long-term applications, while `v10` might be preferable for short-term tasks requiring rapid initial gains. The variance patterns highlight trade-offs between stability and peak performance.