## Diagram: Process Flow for Meteorological Question Analysis
### Overview
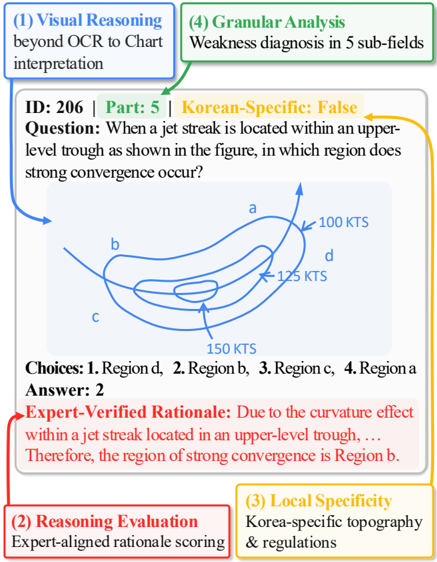
The diagram illustrates a structured workflow for analyzing a meteorological question involving jet stream dynamics. It integrates visual reasoning, granular analysis, local specificity, and expert evaluation to determine the correct answer to a question about jet streak convergence in an upper-level trough.
### Components/Axes
1. **Top Section (Flowchart Layout)**:
- **Section 1**: "Visual Reasoning beyond OCR to Chart interpretation" (Blue box with black text).
- **Section 2**: "Reasoning Evaluation" (Red box with black text).
- **Section 3**: "Local Specificity" (Yellow box with black text).
- **Section 4**: "Granular Analysis" (Green box with black text).
- Arrows connect sections 1 → 4 → 3 → 2, forming a cyclical process.
2. **Central Question Box**:
- **ID**: 206 | Part: 5 | Korean-Specific: False (Green text).
- **Question**: "When a jet streak is located within an upper-level trough as shown in the figure, in which region does strong convergence occur?" (Black text).
- **Choices**:
1. Region d, 2. Region b, 3. Region c, 4. Region a (Black text).
- **Answer**: 2 (Black text).
3. **Regional Diagram**:
- Arrows labeled with KTS values (100 KTS, 125 KTS, 150 KTS) form a cyclical pattern.
- Regions labeled **a, b, c, d** (Blue text).
- Arrows point to regions with annotations like "100 KTS" and "150 KTS".
4. **Expert-Verified Rationale**:
- Red text box with explanation: "Due to the curvature effect within a jet streak located in an upper-level trough, ... Therefore, the region of strong convergence is Region b."
### Detailed Analysis
- **Section 1 (Visual Reasoning)**: Focuses on interpreting charts beyond OCR, emphasizing spatial analysis of meteorological data.
- **Section 4 (Granular Analysis)**: Breaks down weaknesses into 5 sub-fields, though specifics are not detailed in the image.
- **Section 3 (Local Specificity)**: Highlights Korea-specific topography and regulations, though marked as "False" for this question.
- **Section 2 (Reasoning Evaluation)**: Uses expert-aligned rationale scoring to validate answers.
- **Regional Diagram**:
- Arrows indicate wind flow dynamics, with higher KTS values (150 KTS) near Region b.
- The curvature effect in jet streams causes convergence in Region b, as explained in the rationale.
### Key Observations
- The correct answer (Region b) is explicitly stated, with the rationale linking it to the curvature effect in jet streams.
- KTS values (100, 125, 150) suggest wind speed gradients, with stronger convergence where flow accelerates (Region b).
- The flowchart emphasizes iterative analysis: visual reasoning → granular analysis → local specificity → expert evaluation.
### Interpretation
The diagram demonstrates a systematic approach to solving meteorological problems by combining domain-specific knowledge (jet stream dynamics) with structured reasoning. The curvature effect in upper-level troughs causes wind acceleration and convergence in Region b, validated by expert evaluation. The exclusion of Korea-specific factors ("Korean-Specific: False") indicates the answer applies broadly, not regionally. This workflow ensures accuracy by cross-referencing visual data, physical principles, and expert judgment.