## Line Chart with Geometric Shapes: Nested Regions and Error Bounds
### Overview
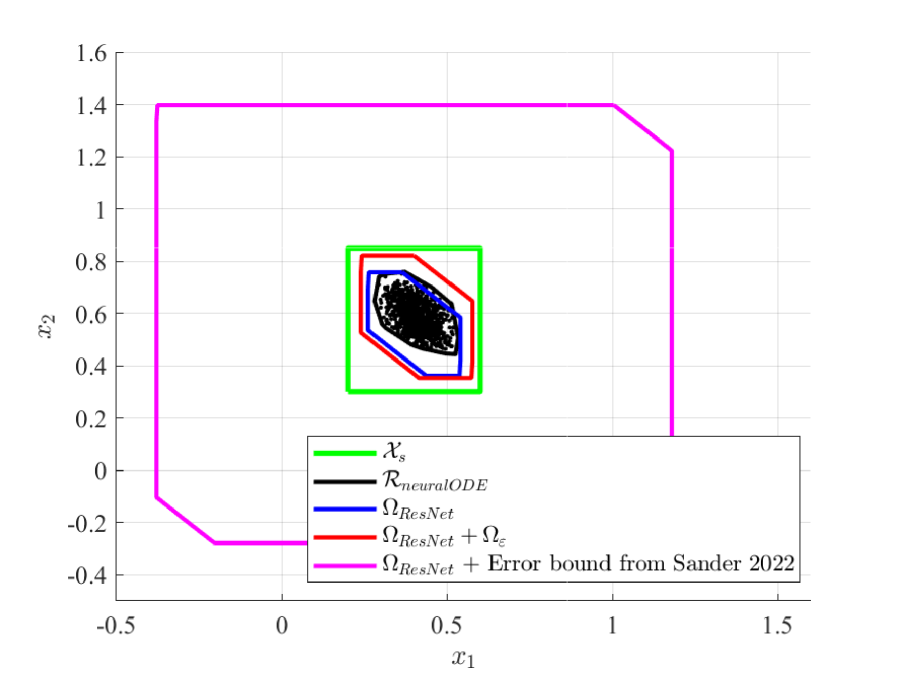
The image depicts a 2D coordinate system with axes labeled **x₁** (horizontal, -0.5 to 1.5) and **x₂** (vertical, -0.4 to 1.6). It contains five geometric shapes and data series, each associated with a legend label. The outermost element is a magenta rectangle, enclosing progressively smaller nested shapes (green rectangle, red hexagon, blue hexagon) and scattered black points. The legend clarifies the meaning of each color and label.
---
### Components/Axes
- **Axes**:
- **x₁**: Horizontal axis, range [-0.5, 1.5], labeled at intervals of 0.5.
- **x₂**: Vertical axis, range [-0.4, 1.6], labeled at intervals of 0.2.
- **Legend** (bottom-right corner):
- **Green**: **Xₛ** (smallest green rectangle).
- **Black**: **R_neuralODE** (scattered points).
- **Blue**: **Ω_ResNet + Ω_ε** (inner blue hexagon).
- **Red**: **Ω_ResNet + Ω_ε + Error bound from Sander 2022** (outer red hexagon).
- **Magenta**: **Ω_ResNet + Error bound from Sander 2022** (outermost magenta rectangle).
---
### Detailed Analysis
1. **Magenta Rectangle** (Ω_ResNet + Error bound from Sander 2022):
- Forms a closed loop with vertices at approximately:
- (-0.5, -0.2) → (-0.5, 1.4) → (1.5, 1.4) → (1.5, 0.8) → (1, 0.8) → (1, -0.2) → (-0.5, -0.2).
- Encloses all other elements.
2. **Green Rectangle** (Xₛ):
- Centered at (0.5, 0.5), with sides at x₁ = 0.3–0.7 and x₂ = 0.3–0.7.
- Contains all inner shapes.
3. **Red Hexagon** (Ω_ResNet + Ω_ε + Error bound from Sander 2022):
- Inscribed within the green rectangle, with vertices forming a hexagon.
- Slightly offset from the green rectangle’s edges.
4. **Blue Hexagon** (Ω_ResNet + Ω_ε):
- Inscribed within the red hexagon, with vertices forming a smaller hexagon.
- Contains all black points.
5. **Black Points** (R_neuralODE):
- Scattered within the blue hexagon, densely clustered near (0.5, 0.5).
---
### Key Observations
- **Nested Structure**: The magenta rectangle encloses the green rectangle, which contains the red hexagon, followed by the blue hexagon. This suggests hierarchical error bounds or confidence intervals.
- **Data Distribution**: Black points (R_neuralODE) are concentrated in the blue hexagon, indicating a relationship between the neural ODE model and the ResNet error bounds.
- **Error Bound Overlap**: The red and magenta lines share the "Error bound from Sander 2022" label, implying additive error contributions from ResNet and Sander’s theoretical framework.
---
### Interpretation
The chart visualizes nested error bounds or confidence regions for a neural network model (ResNet) combined with a neural ODE. The magenta rectangle represents the total error bound from Sander (2022), while the green, red, and blue shapes likely represent progressively tighter approximations or components of the error. The black points (R_neuralODE) suggest that the neural ODE model’s predictions align closely with the ResNet error bounds (blue hexagon). The overlapping labels for red and magenta lines indicate that the error bound from Sander 2022 is a cumulative effect of ResNet’s inherent error (Ω_ResNet) and additional theoretical contributions (Ω_ε). This structure may reflect a multi-stage analysis of model uncertainty or robustness.