## Line Graph: Convergence of ⟨logPℓ_AR⟩ with Number of Layers
### Overview
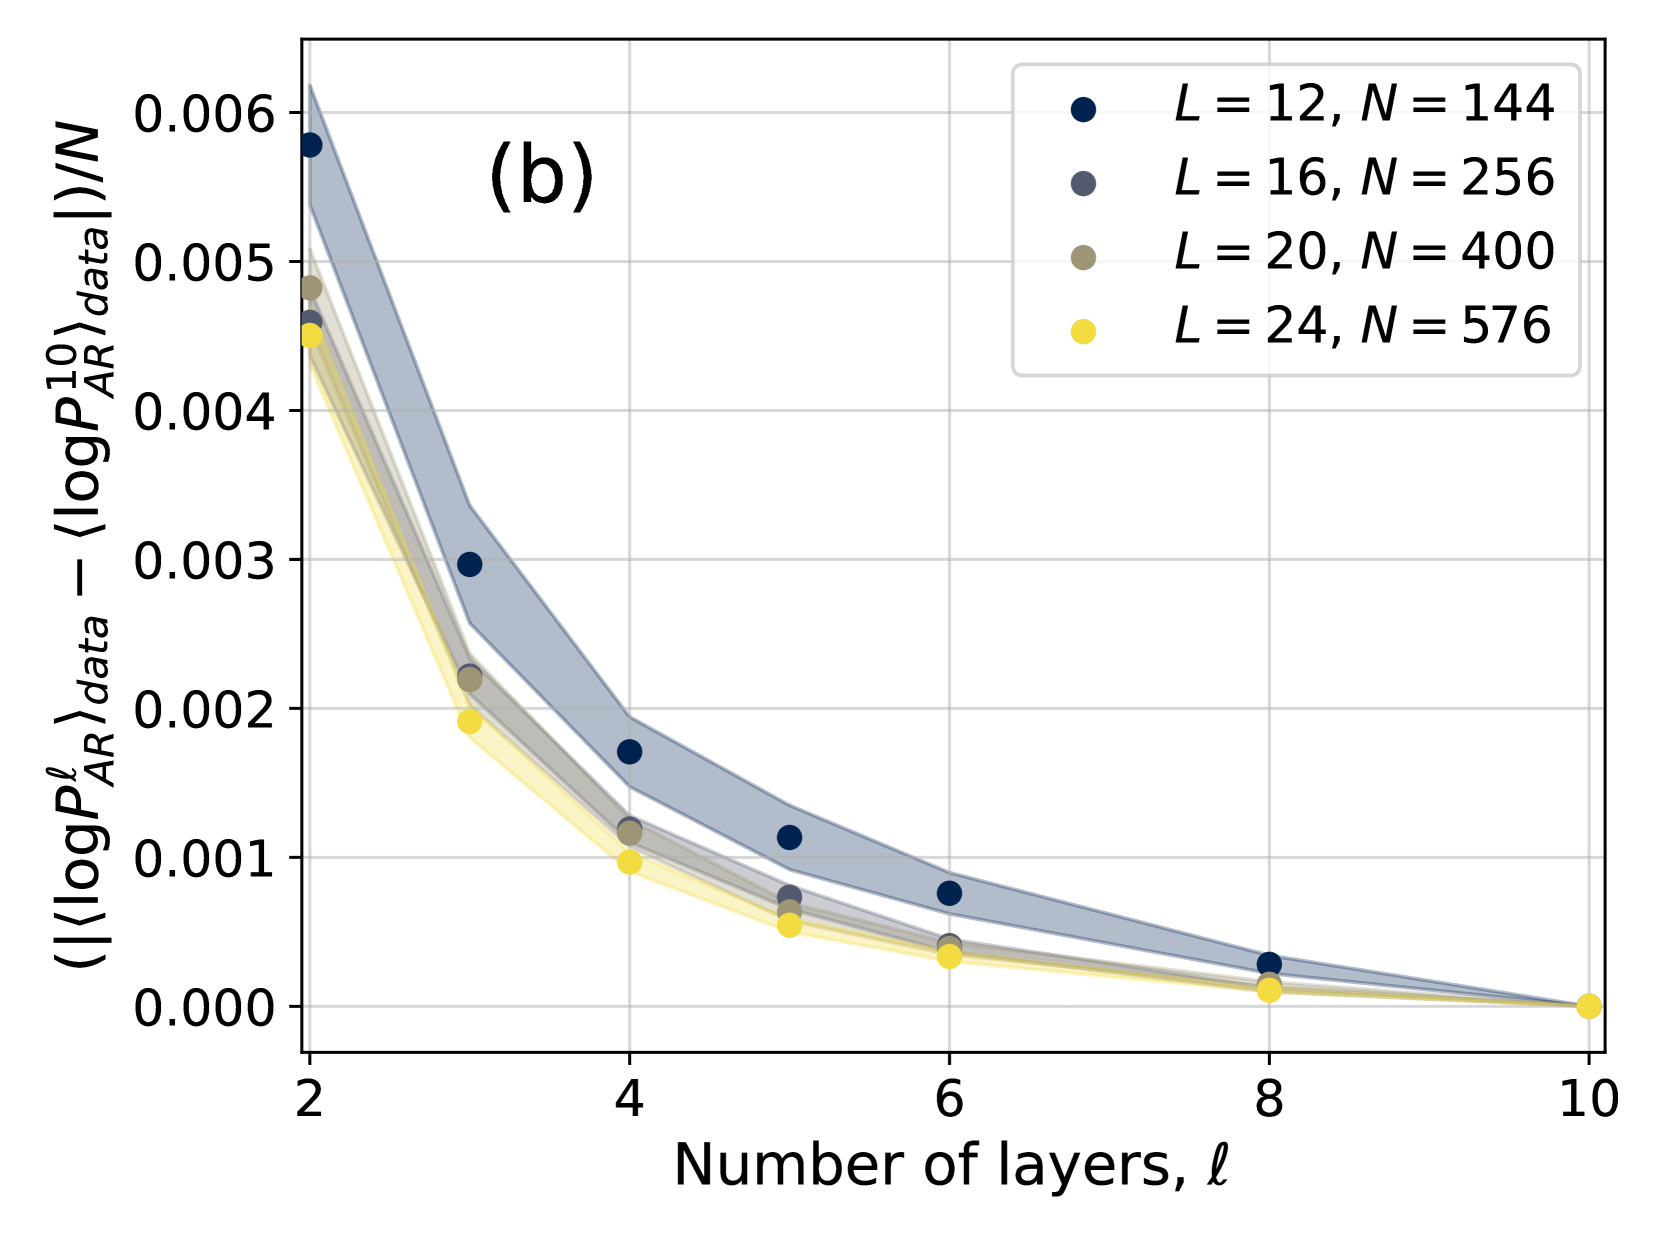
The graph illustrates the convergence behavior of the average absolute difference between ⟨logPℓ_AR⟩_data and ⟨logPℓ_AR⟩_data across varying numbers of layers (ℓ). Four data series are plotted, each corresponding to different combinations of model depth (L) and sample size (N). The y-axis represents the normalized absolute difference, while the x-axis shows the number of layers.
### Components/Axes
- **X-axis**: "Number of layers, ℓ" (integer values from 2 to 10)
- **Y-axis**: "(|⟨logPℓ_AR⟩_data − ⟨logPℓ_AR⟩_data|)/N" (normalized absolute difference, logarithmic scale from 0.000 to 0.006)
- **Legend**: Located in the top-right corner, with four entries:
- Dark blue: L = 12, N = 144
- Gray: L = 16, N = 256
- Olive: L = 20, N = 400
- Yellow: L = 24, N = 576
- **Shaded Regions**: Confidence intervals or error margins around each data series.
### Detailed Analysis
1. **L = 12, N = 144 (Dark Blue)**:
- Data points at ℓ = 2, 3, 4, 5, 6, 7, 8.
- Values: 0.006 (ℓ=2), 0.003 (ℓ=3), 0.0018 (ℓ=4), 0.0012 (ℓ=5), 0.0009 (ℓ=6), 0.0007 (ℓ=7), 0.0002 (ℓ=8).
- Trend: Steepest decline, with values dropping by ~50% between ℓ=2 and ℓ=3, then gradually flattening.
2. **L = 16, N = 256 (Gray)**:
- Data points at ℓ = 2, 3, 4, 5, 6, 7, 8, 9, 10.
- Values: 0.005 (ℓ=2), 0.0025 (ℓ=3), 0.0015 (ℓ=4), 0.001 (ℓ=5), 0.0008 (ℓ=6), 0.0006 (ℓ=7), 0.0004 (ℓ=8), 0.0003 (ℓ=9), 0.0002 (ℓ=10).
- Trend: Smoother decline, with ~50% reduction between ℓ=2 and ℓ=3, followed by slower convergence.
3. **L = 20, N = 400 (Olive)**:
- Data points at ℓ = 2, 3, 4, 5, 6, 7, 8, 9, 10.
- Values: 0.0045 (ℓ=2), 0.002 (ℓ=3), 0.001 (ℓ=4), 0.0008 (ℓ=5), 0.0006 (ℓ=6), 0.0005 (ℓ=7), 0.0004 (ℓ=8), 0.0003 (ℓ=9), 0.0002 (ℓ=10).
- Trend: Moderate decline, with ~55% reduction between ℓ=2 and ℓ=3, then gradual flattening.
4. **L = 24, N = 576 (Yellow)**:
- Data points at ℓ = 2, 3, 4, 5, 6, 7, 8, 9, 10.
- Values: 0.004 (ℓ=2), 0.0018 (ℓ=3), 0.001 (ℓ=4), 0.0007 (ℓ=5), 0.0005 (ℓ=6), 0.0004 (ℓ=7), 0.0003 (ℓ=8), 0.0002 (ℓ=9), 0.0001 (ℓ=10).
- Trend: Fastest initial decline (~55% between ℓ=2 and ℓ=3), followed by steady convergence.
### Key Observations
- **Universal Decline**: All series show a decreasing trend as ℓ increases, indicating improved convergence with more layers.
- **Rate of Convergence**: Larger L and N values (e.g., L=24, N=576) achieve lower absolute differences faster than smaller configurations.
- **Shaded Regions**: Narrower error margins at higher ℓ values suggest increased precision with deeper models.
- **ℓ=10 Asymptote**: All series approach ~0.0001–0.0002 at ℓ=10, implying diminishing returns beyond this point.
### Interpretation
The graph demonstrates that increasing the number of layers (ℓ) reduces the discrepancy between ⟨logPℓ_AR⟩_data and ⟨logPℓ_AR⟩_data, with larger models (higher L and N) achieving faster convergence. The shaded regions highlight that uncertainty decreases as ℓ grows, reinforcing the reliability of deeper models. The rapid initial decline (ℓ=2 to ℓ=3) across all series suggests that early layers have the most significant impact on convergence. The flattening trend at higher ℓ values implies diminishing returns, where additional layers contribute minimally to further improvement. This could inform model design choices, balancing computational cost (larger L/N) against performance gains.