## Diagram: Cylindrical Trace with Operator Insertions
### Overview
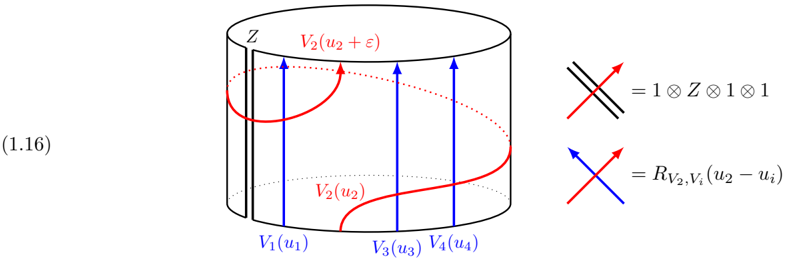
This technical diagram, labeled (1.16), illustrates a process on a cylindrical surface, likely representing a trace or a partition function in a quantum mechanical or statistical mechanics context. It features vertical lines (blue) and a wrapping line (red) with associated labels, along with a legend defining the interactions (crossings) between these lines in terms of operators.
### Components
* **Main Diagram (Cylinder):**
* A cylinder is depicted with its axis oriented vertically.
* **Bottom Boundary:** Three points on the bottom edge are labeled with blue text: `V₁(u₁)`, `V₃(u₃)`, and `V₄(u₄)`.
* **Top Boundary:** The top edge has a label `Z` near a vertical slit and a red label `V₂(u₂ + ε)`.
* **Vertical Lines (Blue):** Three straight vertical lines with upward-pointing arrows originate from `V₁(u₁)`, `V₃(u₃)`, and `V₄(u₄)` at the bottom and extend to the top of the cylinder.
* **Wrapping Line (Red):** A red line with an upward-pointing arrow originates from the bottom, between `V₁(u₁)` and `V₃(u₃)`. It is labeled `V₂(u₂)` near its start. This line travels upwards, wraps around the back of the cylinder (indicated by a dotted segment), and emerges at the top, ending at the label `V₂(u₂ + ε)`.
* **Slit/Cut:** A vertical line segment on the left side of the cylinder, marked with `Z` at the top, suggests a cut or a specific boundary condition.
* **Legend (Right Side):**
* **Top Entry:** Shows a red line crossing over two parallel black lines (representing the slit/boundary). This crossing is equated to the operator product: `= 1 ⊗ Z ⊗ 1 ⊗ 1`.
* **Bottom Entry:** Shows a red line crossing over a blue line. This crossing is equated to an R-matrix or similar operator: `= R_{V₂, Vᵢ}(u₂ - uᵢ)`. The subscript `i` likely refers to the index of the blue line (1, 3, or 4).
* **Label:**
* **(1.16):** An equation or figure number positioned to the left of the cylinder.
### Detailed Analysis
The diagram visually represents a mathematical expression. The vertical blue lines `V₁(u₁)`, `V₃(u₃)`, and `V₄(u₄)` likely represent states or spaces associated with spectral parameters `u₁`, `u₃`, and `u₄`. The red line `V₂(u₂)` represents another state or space with parameter `u₂` that "moves" or is traced around the cylinder.
As the red line `V₂` traverses the cylinder from bottom to top, it crosses the vertical blue lines. According to the legend, each crossing of the red line `V₂` over a blue line `Vᵢ` introduces an operator `R_{V₂, Vᵢ}(u₂ - uᵢ)`. The red line also crosses the "seam" or slit of the cylinder, which is associated with the `Z` operator, as indicated by the top entry in the legend (`1 ⊗ Z ⊗ 1 ⊗ 1`).
The red line starts at the bottom with parameter `u₂` and ends at the top with parameter `u₂ + ε`, suggesting a shift or a specific operation related to the parameter `ε`. The overall process on the cylinder, with the trace (connecting top and bottom) and the operator insertions from the crossings, likely represents a specific quantity, such as a twisted partition function or a correlation function.
### Key Observations
* The diagram uses color coding: blue for the stationary vertical lines (`V₁`, `V₃`, `V₄`) and red for the wrapping line (`V₂`).
* The interactions are defined locally by the crossings, as specified in the legend.
* The presence of the `Z` operator at the seam and the shift `ε` in the parameter of `V₂` are crucial elements of the setup.
* The notation `R_{V₂, Vᵢ}(u₂ - uᵢ)` is typical for the R-matrix in integrable systems, depending on the difference of spectral parameters.
### Interpretation
This diagram likely illustrates the calculation of a trace of a transfer matrix or a similar operator in the context of an integrable system (e.g., a spin chain or a lattice model). The vertical lines represent the quantum spaces at each site, and the wrapping red line represents an auxiliary space used to construct the transfer matrix. The crossings correspond to the action of the R-matrix, which encodes the local interactions. The `Z` operator at the boundary introduces a "twist" or a specific boundary condition, and the parameter shift `ε` might be related to a derivative or a specific limit of the transfer matrix. The entire figure visually encapsulates a complex mathematical expression involving a product of R-matrices and a boundary operator `Z` within a trace operation.