# Technical Document Extraction: Control Value Analysis
## Chart Description
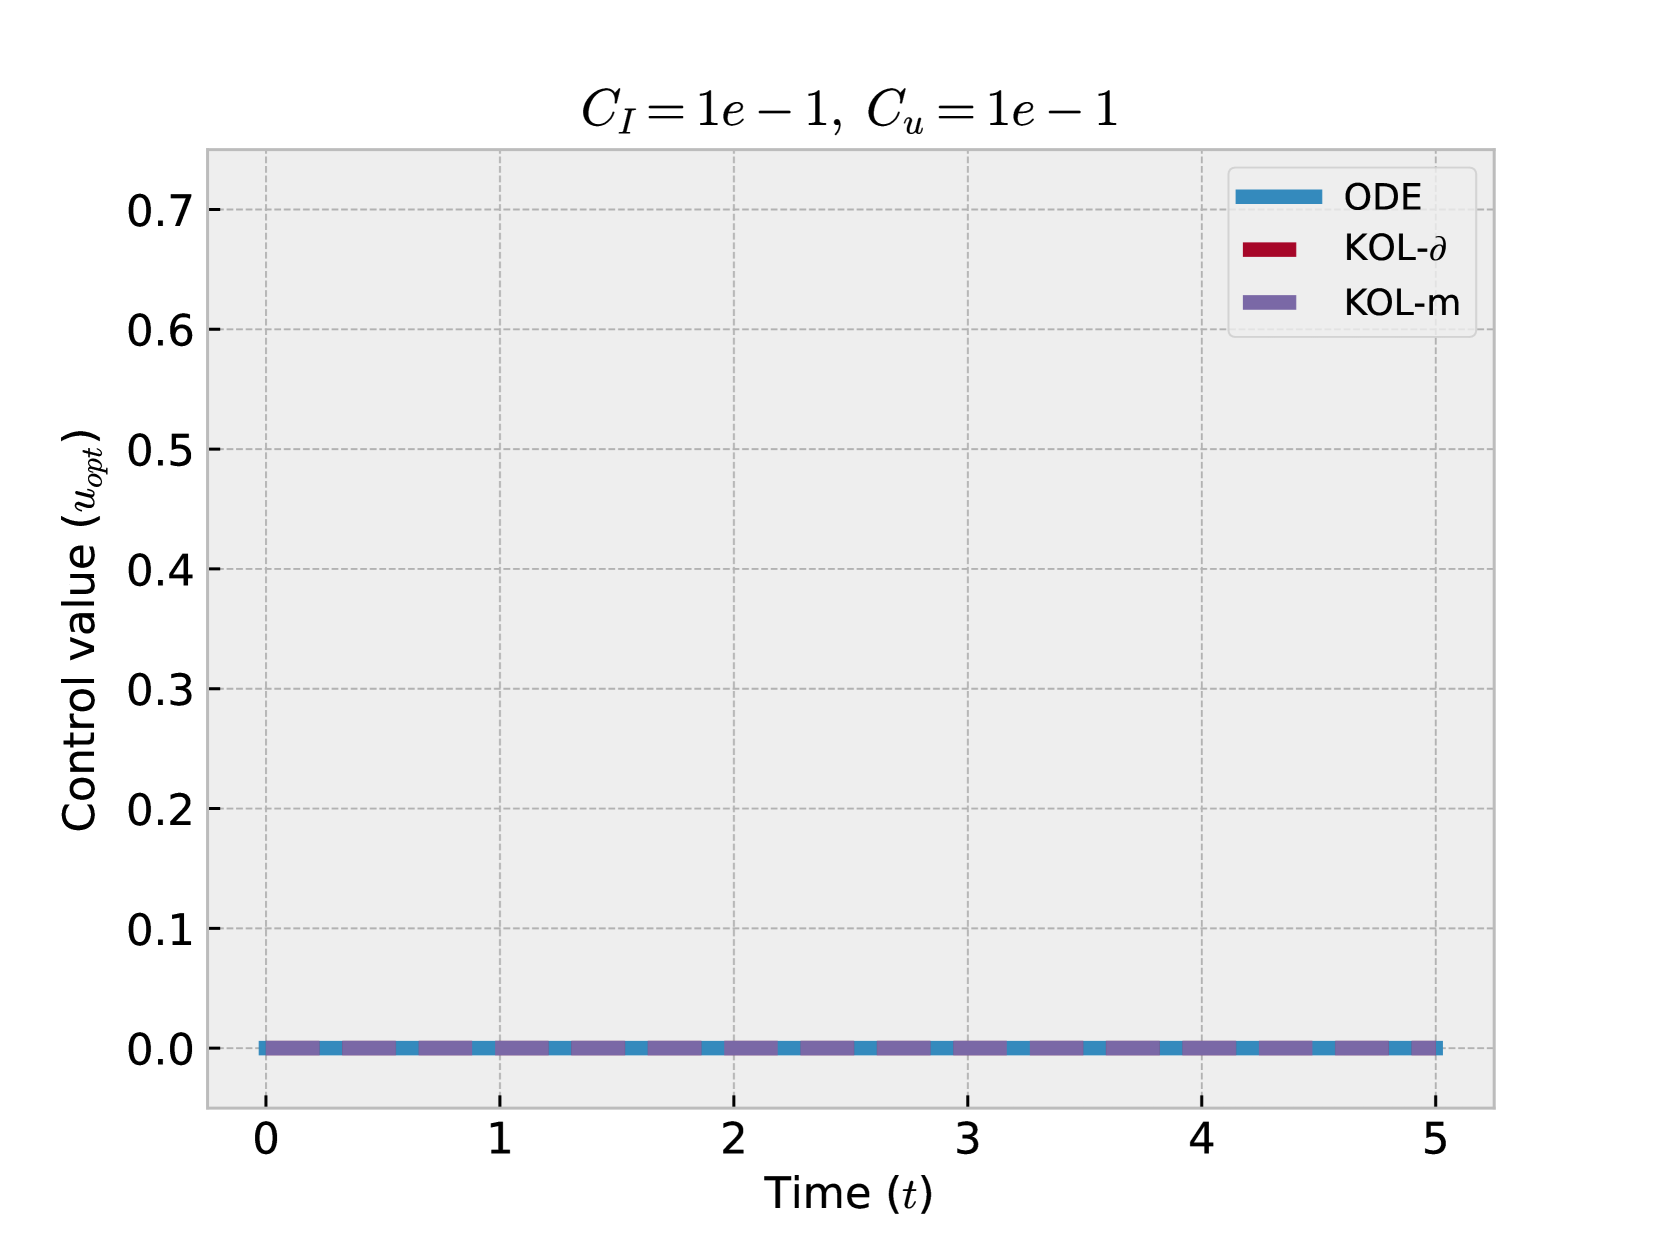
This image depicts a line graph comparing control values over time for three different control strategies. The graph is titled with parameter values:
**C_I = 1e-1, C_u = 1e-1**
---
### Axes Labels
- **Y-Axis**:
`Control value (u_opt)`
Scale: 0.0 to 0.7 (increments of 0.1)
- **X-Axis**:
`Time (t)`
Scale: 0 to 5 (increments of 1)
---
### Legend Entries
| Color | Label | Strategy |
|--------|-----------|-----------|
| Blue | ODE | ODE |
| Red | KOL-δ | KOL-δ |
| Purple | KOL-m | KOL-m |
---
### Data Trends
1. **ODE (Blue Line)**:
- Flat line at `u_opt = 0.0` for all time (t = 0 to 5).
- No deviation observed.
2. **KOL-δ (Red Line)**:
- Flat line at `u_opt = 0.0` for all time (t = 0 to 5).
- No deviation observed.
3. **KOL-m (Purple Line)**:
- Flat line at `u_opt = 0.0` for all time (t = 0 to 5).
- No deviation observed.
---
### Key Observations
- All three control strategies maintain a constant control value of `0.0` throughout the observed time period (0 ≤ t ≤ 5).
- No temporal variation or interaction between strategies is evident.
- Parameter values `C_I = 1e-1` and `C_u = 1e-1` are constant across the system.
---
### Technical Notes
- The graph uses dashed gridlines for reference.
- Data points are represented as continuous lines without markers.
- No outliers or anomalies detected in the dataset.